By default, the Debug tool window opens when your program hits a breakpoint and is not hidden when the session is terminated. To change this behavior, go to the Build, Execution, Deployment | Debugger settings page Ctrl+Alt+S and clear the Show debug window on breakpoint checkbox.
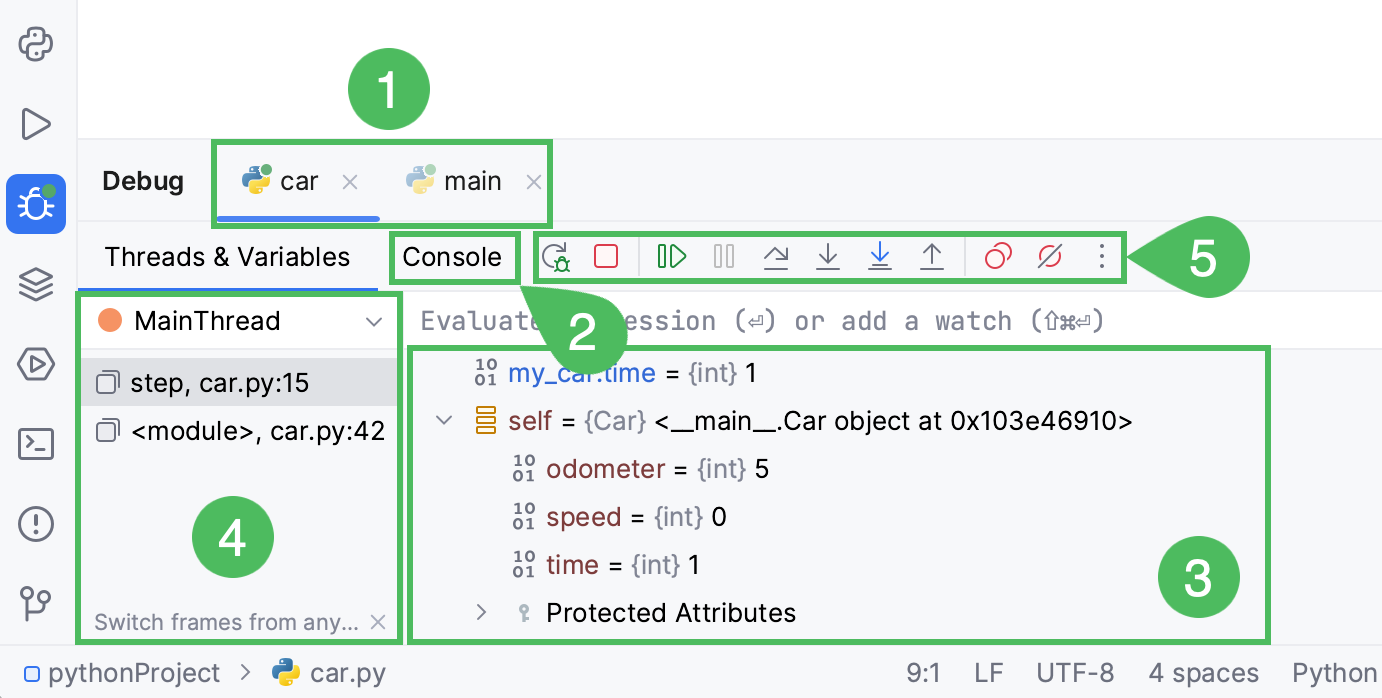
The available debug sessions are separated into tabs in the top part of the Debug tool window.
If you enable the Services tool window for specific run/debug configurations, the entire view of the Debug tool window will be displayed inside the Services tool window when you debug any of these configurations.
All the information in the editor, like inline variable values and execution point, is shown for the selected session tab. This is important if you are running several debug sessions in parallel that use the same .
When you close a tab, the corresponding debug session terminates.
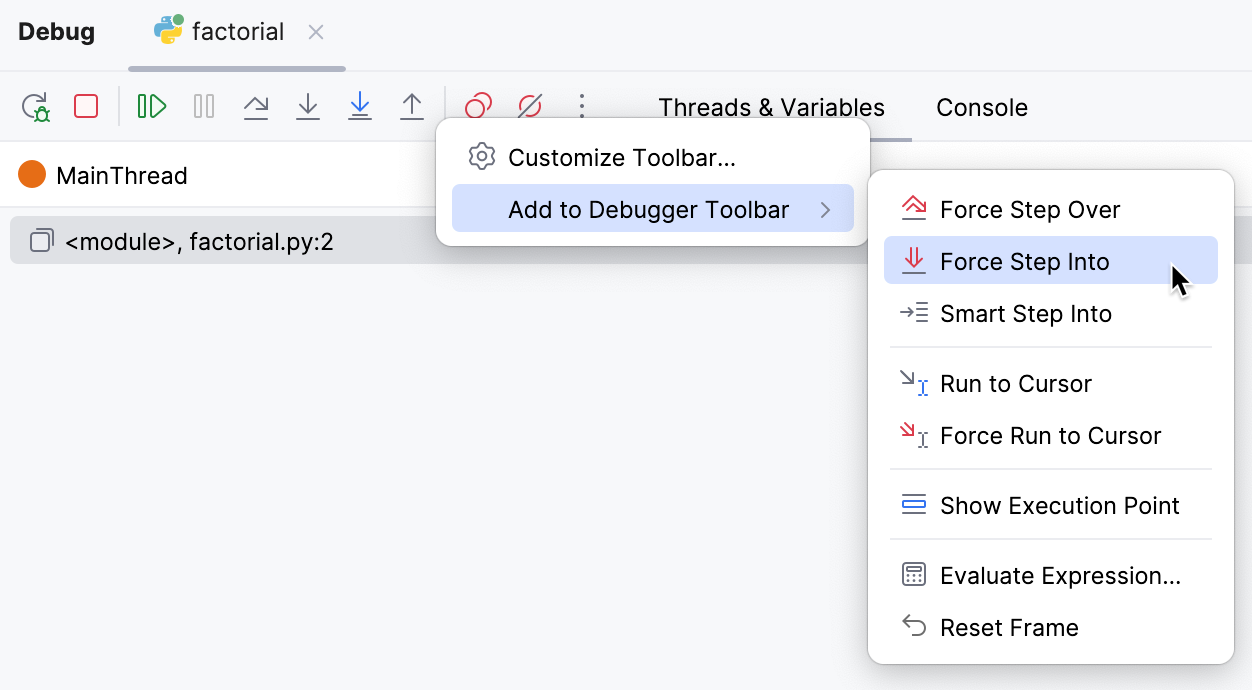
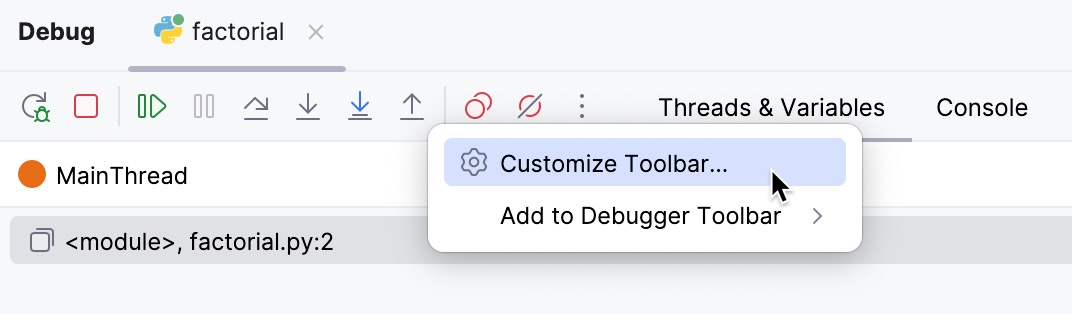
You can configure the list of actions available on the toolbar according to your preferences.
Customize the debugger's toolbar
To add a debugging action, right-click the debugger toolbar, select Add to Debugger Toolbar from the context menu, and then select the required action from the list.
In the dialog that opens, click Add and then select the required action.
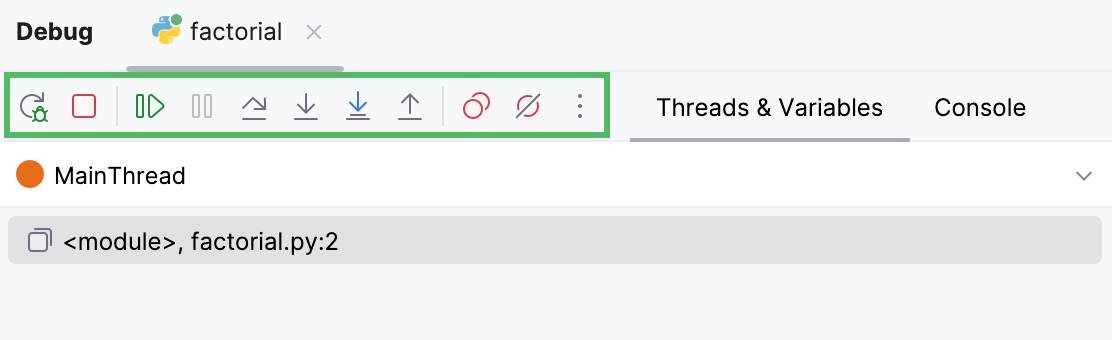
Debugger toolbar
Regardless of the selected tab, you can always use the following toolbar controls in the left part of the window:
Item
Tooltip and Shortcut
Description
Restart
Rerun
Ctrl+F5
Click this button to stop the current application and run it again.
Resume
Resume Program
F9
When an application is paused, click this button to resume program execution.
Pause
Pause Program
Ctrl+Pause
Click this button to pause program execution.
Stop
Stop
Ctrl+F2
Click this button to terminate the current process externally by means of the standard shutdown script.
Clicking the button once invokes soft kill allowing the application to catch the SIGINT event and perform graceful termination (on Windows, the Ctrl+C event is emulated). After the button is clicked once, it is replaced with the Kill Process button indicating that subsequent click will lead to force termination of the application, for example on Unix SIGKILL is sent.
View breakpoints
View Breakpoints
Ctrl+Shift+F8
Click this button to open the Breakpoints dialog where you can configure breakpoints behavior.
Mute breakpoints
Mute Breakpoints
Use this button to toggle breakpoints status.
When the button is pressed in the toolbar of the Debug tool window, all the breakpoints in the project are muted, and their icons become grey: muted_breakpoint.png.
You can temporarily mute all breakpoints in the project to execute the program without stopping at breakpoints.
More
More
Opens the menu with the following additional actions:
Show Variable Values in Editor: select this option to enable the Inline Debugging feature that allows viewing the values of variables right next to their usage in the editor.
Sort Variables Alphabetically: select this option to sort the values in the Variables pane in the alphabetical order.
Unmute Breakpoints on Session Finish: select this option to re-enable all disabled breakpoints after the debugging session has been finished.
Show Return Values: select this option to display the return values of the executed functions in the current frame while stepping.
Simplified Variables View: Select this option to include the following names into the Special Variables group:
all variables with the dunder names.
all instances of function, classobj and module.
all the IPython internal variables, if debug console with IPython has been started.
Variables Loading Policy. You can choose one of the following policies:
Synchronously: If this option is enabled, the message shown is Collecting data, and after that the debugger shows the variables' values.
Asynchronously: If this option is enabled, the variables in the debugger are loaded separately (asynchronously). In this case, if loading a variable takes a long time, the debugger shows ...Loading Value message, and only after that it shows its value or the Loading timed out message, if the variable is too slow. Mind the warning message that suggest switching to the on demand mode.
On demand: If this option is enabled, the debugger shows Show Value message. Click it to enable loading.
Note that any changes in the loading policies become effective after you rerun the debugging process.
Item
Tooltip and Shortcut
Description
Restart
Rerun
Ctrl+F5
Click this button to stop the current application and run it again.
Resume
Resume Program
F9
When an application is paused, click this button to resume program execution.
Pause
Pause Program
Ctrl+Pause
Click this button to pause program execution.
Stop
Stop
Ctrl+F2
Click this button to terminate the current process externally by means of the standard shutdown script .
View breakpoints
View Breakpoints
Ctrl+Shift+F8
Click this button to open the Breakpoints dialog where you can configure breakpoints behavior.
Mute breakpoints
Mute Breakpoints
Use this button to toggle breakpoints status.
When the button is pressed in the toolbar of the Debug tool window, all the breakpoints in the project are muted, and their icons become grey: muted_breakpoint.png.
You can temporarily mute all the breakpoints in a project to execute the program without stopping at breakpoints.
Show options menu
Settings
Click this button to open the menu with the following options:
Show Values Inline: select this option to enable the Inline Debugging feature that allows viewing the values of variables right next to their usage in the editor.
Sort Values Alphabetically: select this option to sort the values in the Variables pane in the alphabetical order.
Unmute Breakpoints on Session Finish: select this option to re-enable all disabled breakpoints after the debugging session has been finished.
Show Return Values: select this option to display the return values of the executed functions in the current frame while stepping.
Simplified Variables View: Select this option to include the following names into the Special Variables group:
all variables with the dunder names.
all instances of function, classobj and module.
all the IPython internal variables, if debug console with IPython has been started.
Variables Loading Policy. You can choose one of the following policies:
Synchronously: If this option is enabled, the message shown is Collecting data, and after that the debugger shows the variables' values.
Asynchronously: If this option is enabled, the variables in the debugger are loaded separately (asynchronously). In this case, if loading a variable takes a long time, the debugger shows ...Loading Value message, and only after that it shows its value or the Loading timed out message, if the variable is too slow. Mind the warning message that suggest switching to the on demand mode.
On demand: If this option is enabled, the debugger shows Show Value message. Click it to enable loading.
Note that any changes in the loading policies become effective after you rerun the debugging process.
Pin Tab
Click this button to pin or unpin the current tab. You may need to pin a tab to prevent it from closing automatically when the maximum number of tabs is reached in this window.
Stepping toolbar
Item
Tooltip and Shortcut
Description
Show Execution Point
Show Execution Point
Alt+F10
Click this button to highlight the current execution point in the editor and show the corresponding stack frame in the Frames pane.
Step over
Step Over
F8
Click this button to execute the program until the next line in the current method or file, skipping the methods referenced at the current execution point (if any). If the current line is the last one in the method, execution steps to the line executed right after this method.
Force step over
Force Step Over
Alt+Shift+F8
Click this button to have the debugger step over the method even if this method has breakpoints inside.
Step into
Step Into
F7
Click this button to have the debugger step into the method called at the current execution point.
Smart step into
Smart Step Into
Shift+F7
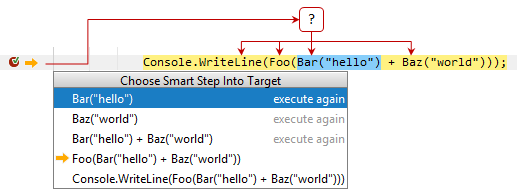
If the current line contains several nested calls, PyCharm lets you choose a call to step into. Consider the following code line:
The line contains several calls and if you use Step Into, the debugger will first step into the implementation of Bar(), then into the implementation of Baz() and so on.
If you want to choose which of the calls should be stepped into, for example, Bar(), you can use Smart Step Into Smart Step Into Shift+F7:
When you choose the function to step into, the debugger will set the execution pointer at the first statement of the selected function.
The selector also shows you which of the calls were already executed and allows you to execute these calls again.
You can enable the 'smart step into' behavior when you invoke Step IntoF7 in a line that contains multiple method calls. To do so, select Always do smart step into on the Build, Execution, Deployment | Debugger | Stepping settings page Ctrl+Alt+S.
Step into my code
Step Into My Code
Alt+Shift+F7
Click this button to skip stepping into library sources and keep focused on your own code.
Step out
Step Out
Shift+F8
Click this button to have the debugger step out of the current method, to the line executed right after it.
Run to cursor
Run to Cursor
Alt+F9
Click this button to resume program execution and pause until the execution point reaches the line at the current caret location in the editor. No breakpoint is required. Actually, there is a temporary breakpoint set for the current line at the caret, which is removed once program execution is paused. Thus, if the caret is positioned at the line which has already been executed, the program will be just resumed for further execution, because there is no way to roll back to previous breakpoints. This action is especially useful when you have stepped deep into the methods sequence and need to step out of several methods at once.
If there are breakpoints set for the lines that should be executed before bringing you to the specified line, the debugger will pause at the first encountered breakpoint.
Force run to cursor
Run to Cursor Non-Stop
Ctrl+Alt+F9
If there are breakpoints between the current execution point and the target statement, you can force the debugger to skip these breakpoints with the Run to Cursor Non-Stop Run to Cursor Non-Stop command Ctrl+Alt+F9.
Click this button to highlight the current execution point in the editor and show the corresponding stack frame in the Frames pane.
Step over
Step Over
F8
Click this button to execute the program until the next line in the current method or file, skipping the methods referenced at the current execution point (if any). If the current line is the last one in the method, execution steps to the line executed right after this method.
Step into
Step Into
F7
Click this button to have the debugger step into the method called at the current execution point.
Force step into
Force Step Into
Alt+Shift+F7
Click this button to have the debugger step into the method called in the current execution point even if this method is to be skipped.
Step into my code
Step Into My Code
Alt+Shift+F7
Click this button to skip stepping into library sources and keep focused on your own code.
Step out
Step Out
Shift+F8
Click this button to have the debugger step out of the current method, to the line executed right after it.
Run to cursor
Run to Cursor
Alt+F9
Click this button to resume program execution and pause until the execution point reaches the line at the current cursor location in the editor. No breakpoint is required. Actually, there is a temporary breakpoint set for the current line at the caret, which is removed once program execution is paused. Thus, if the caret is positioned at the line which has already been executed, the program will be just resumed for further execution, because there is no way to roll back to previous breakpoints. This action is especially useful when you have stepped deep into the methods sequence and need to step out of several methods at once.
If there are breakpoints set for the lines that should be executed before bringing you to the specified line, the debugger will pause at the first encountered breakpoint.