Practical Management Science
Practical Management Science
6th Edition
ISBN: 9781337406659
Author: WINSTON, Wayne L.
Publisher: Cengage,
expand_more
expand_more
format_list_bulleted
Bartleby Related Questions Icon
Related questions
Question
I need typing clear urjent no chatgpt used i will give 5 upvotes pls full explain
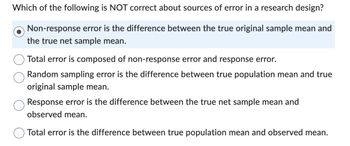
Transcribed Image Text:Which of the following is NOT correct about sources of error in a research design?
Non-response error is the difference between the true original sample mean and
the true net sample mean.
Total error is composed of non-response error and response error.
Random sampling error is the difference between true population mean and true
original sample mean.
Response error is the difference between the true net sample mean and
observed mean.
Total error is the difference between true population mean and observed mean.
Expert Solution
Check MarkThis question has been solved!
Explore an expertly crafted, step-by-step solution for a thorough understanding of key concepts.
bartleby
Step by stepSolved in 2 steps
Knowledge Booster
Background pattern image
Similar questions
- Do the sales prices of houses in a given community vary systematically with their sizes (as measured in square feet)? Answer this question by estimating a simple regression equation where the sales price of the house is the dependent variable, and the size of the house is the explanatory variable. Use the sample data given in P13_06.xlsx. Interpret your estimated equation, the associated R-square value, and the associated standard error of estimate.arrow_forwardThe owner of a restaurant in Bloomington, Indiana, has recorded sales data for the past 19 years. He has also recorded data on potentially relevant variables. The data are listed in the file P13_17.xlsx. a. Estimate a simple regression equation involving annual sales (the dependent variable) and the size of the population residing within 10 miles of the restaurant (the explanatory variable). Interpret R-square for this regression. b. Add another explanatory variableannual advertising expendituresto the regression equation in part a. Estimate and interpret this expanded equation. How does the R-square value for this multiple regression equation compare to that of the simple regression equation estimated in part a? Explain any difference between the two R-square values. How can you use the adjusted R-squares for a comparison of the two equations? c. Add one more explanatory variable to the multiple regression equation estimated in part b. In particular, estimate and interpret the coefficients of a multiple regression equation that includes the previous years advertising expenditure. How does the inclusion of this third explanatory variable affect the R-square, compared to the corresponding values for the equation of part b? Explain any changes in this value. What does the adjusted R-square for the new equation tell you?arrow_forwardThe Baker Company wants to develop a budget to predict how overhead costs vary with activity levels. Management is trying to decide whether direct labor hours (DLH) or units produced is the better measure of activity for the firm. Monthly data for the preceding 24 months appear in the file P13_40.xlsx. Use regression analysis to determine which measure, DLH or Units (or both), should be used for the budget. How would the regression equation be used to obtain the budget for the firms overhead costs?arrow_forward
- A trucking company wants to predict the yearly maintenance expense (Y) for a truck using the number of miles driven during the year (X1) and the age of the truck (X2, in years) at the beginning of the year. The company has gathered the data given in the file P13_13.xlsx. Note that each observation corresponds to a particular truck. Estimate a multiple regression equation using the given data. Interpret each of the estimated regression coefficients. Also, interpret the standard error of estimate and the R-square value for these data.arrow_forwardManagement of a home appliance store wants to understand the growth pattern of the monthly sales of a new technology device over the past two years. The managers have recorded the relevant data in the file P13_05.xlsx. Have the sales of this device been growing linearly over the past 24 months? By examining the results of a linear trend line, explain why or why not.arrow_forwardManagement of a home appliance store would like to understand the growth pattern of the monthly sales of Blu-ray disc players over the past two years. Managers have recorded the relevant data in the file P13_33.xlsx. a. Create a scatterplot for these data. Comment on the observed behavior of monthly sales at this store over time. b. Estimate an appropriate regression equation to explain the variation of monthly sales over the given time period. Interpret the estimated regression coefficients. c. Analyze the estimated equations residuals. Do they suggest that the regression equation is adequate? If not, return to part b and revise your equation. Continue to revise the equation until the results are satisfactory.arrow_forward
- An antique collector believes that the price received for a particular item increases with its age and with the number of bidders. The file P13_14.xlsx contains data on these three variables for 32 recently auctioned comparable items. Estimate a multiple regression equation using the given data. Interpret each of the estimated regression coefficients. Is the antique collector correct in believing that the price received for the item increases with its age and with the number of bidders? Interpret the standard error of estimate and the R-square value for these data.arrow_forwardThe management of a technology company is trying to determine the variable that best explains the variation of employee salaries using a sample of 52 full-time employees; see the file P13_08.xlsx. Estimate simple linear regression equations to identify which of the following has the strongest linear relationship with annual salary: the employees gender, age, number of years of relevant work experience prior to employment at the company, number of years of employment at the company, or number of years of post secondary education. Provide support for your conclusion.arrow_forwardThe file P13_26.xlsx contains the monthly number of airline tickets sold by the CareFree Travel Agency. a. Create a time series chart of the data. Based on what you see, which of the exponential smoothing models do you think will provide the best forecasting model? Why? b. Use simple exponential smoothing to forecast these data, using a smoothing constant of 0.1. c. Repeat part b, but search for the smoothing constant that makes RMSE as small as possible. Does it make much of an improvement over the model in part b?arrow_forward
- The file P13_02.xlsx contains five years of monthly data on sales (number of units sold) for a particular company. The company suspects that except for random noise, its sales are growing by a constant percentage each month and will continue to do so for at least the near future. a. Explain briefly whether the plot of the series visually supports the companys suspicion. b. By what percentage are sales increasing each month? c. What is the MAPE for the forecast model in part b? In words, what does it measure? Considering its magnitude, does the model seem to be doing a good job? d. In words, how does the model make forecasts for future months? Specifically, given the forecast value for the last month in the data set, what simple arithmetic could you use to obtain forecasts for the next few months?arrow_forwardThe file P13_25.xlsx contains the quarterly numbers of applications for home mortgage loans at a branch office of Northern Central Bank. a. Create a time series chart of the data. Based on what you see, which of the exponential smoothing models do you think will provide the best forecasting model? Why? b. Use simple exponential smoothing to forecast these data, using a smoothing constant of 0.1. c. Repeat part b, but search for the smoothing constant that makes RMSE as small as possible. Does it make much of an improvement over the model in part b? Is it guaranteed to produce better forecasts for the future?arrow_forwardThe file P14_01.xlsx contains data on 100 consumers who drink beer. Some of them prefer light beer, and others prefer regular beer. A major beer producer believes that the following variables might be useful in discriminating between these two groups: gender, marital status, annual income level, and age. a. Use logistic regression to classify the consumers on the basis of these explanatory variables. How successful is it? Which variables appear to be most important in the classification? b. Consider a new customer: Male, Married, Income 42,000, Age 47. Use the logistic regression equation to estimate the probability that this customer prefers Regular. How would you classify this person?arrow_forward
arrow_back_ios
SEE MORE QUESTIONS
arrow_forward_ios
Recommended textbooks for you
- Text book imagePractical Management ScienceOperations ManagementISBN:9781337406659Author:WINSTON, Wayne L.Publisher:Cengage,Text book imageText book imageMarketingMarketingISBN:9780357033791Author:Pride, William MPublisher:South Western Educational Publishing
Text book image
Practical Management Science
Operations Management
ISBN:9781337406659
Author:WINSTON, Wayne L.
Publisher:Cengage,
Text book image
Text book image
Marketing
Marketing
ISBN:9780357033791
Author:Pride, William M
Publisher:South Western Educational Publishing