分享
这是一个创建于 的文章,其中的信息可能已经有所发展或是发生改变。
???? ginprom
Prometheus metrics exporter for Gin.Inspired by Depado/ginprom.
项目地址:https://github.com/chenjiandongx/ginprom
???? Installation
$ go get -u github.com/chenjiandongx/ginprom
???? Usage
It's easy to get started with ginprom, only a few lines of code needed.
import (
	"github.com/chenjiandongx/ginprom"
	"github.com/gin-gonic/gin"
	"github.com/prometheus/client_golang/prometheus/promhttp"
)
func main() {
 r := gin.Default()
 // use prometheus metrics exporter middleware.
	r.Use(ginprom.PromMiddleware())
 // register the `/metrices` route.
	r.GET("/metrics", ginprom.PromHandler(promhttp.Handler()))
 // your working routes
	r.GET("/", func(c *gin.Context) {
		c.JSON(http.StatusOK, gin.H{"message": "home"})
 })
}
???? Metrics
Details about exposed Prometheus metrics.
| Name | Type | Description |
| service_http_request_count_total | Counter | Total number of HTTP requests made. |
| service_http_request_duration_seconds | Histogram | HTTP request latencies in seconds. |
| service_http_request_size_bytes | Summary | HTTP request sizes in bytes. |
| service_http_response_size_bytes | Summary | HTTP request sizes in bytes. |
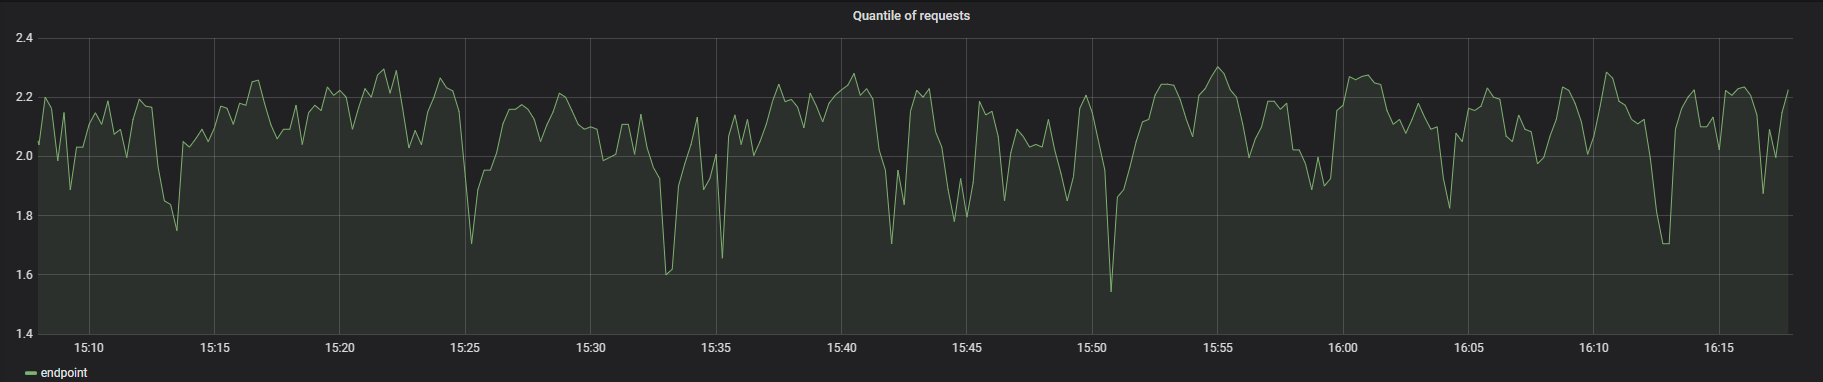
???? Grafana
Although Promethues offers a simple dashboard, Grafana is clearly a better choice. Grafana configuration.
有疑问加站长微信联系(非本文作者)
入群交流(和以上内容无关):加入Go大咖交流群,或添加微信:liuxiaoyan-s 备注:入群;或加QQ群:692541889
关注微信9329 次点击
上一篇:Golang 使用 Prpme
下一篇:go-micro 启动报错
0 回复
暂无回复
添加一条新回复
(您需要 后才能回复 没有账号 ?)
- 请尽量让自己的回复能够对别人有帮助
- 支持 Markdown 格式, **粗体**、~~删除线~~、
`单行代码` - 支持 @ 本站用户;支持表情(输入 : 提示),见 Emoji cheat sheet
- 图片支持拖拽、截图粘贴等方式上传
收入到我管理的专栏 新建专栏
???? ginprom
Prometheus metrics exporter for Gin.Inspired by Depado/ginprom.
项目地址:https://github.com/chenjiandongx/ginprom
???? Installation
$ go get -u github.com/chenjiandongx/ginprom
???? Usage
It's easy to get started with ginprom, only a few lines of code needed.
import (
	"github.com/chenjiandongx/ginprom"
	"github.com/gin-gonic/gin"
	"github.com/prometheus/client_golang/prometheus/promhttp"
)
func main() {
 r := gin.Default()
 // use prometheus metrics exporter middleware.
	r.Use(ginprom.PromMiddleware())
 // register the `/metrices` route.
	r.GET("/metrics", ginprom.PromHandler(promhttp.Handler()))
 // your working routes
	r.GET("/", func(c *gin.Context) {
		c.JSON(http.StatusOK, gin.H{"message": "home"})
 })
}
???? Metrics
Details about exposed Prometheus metrics.
| Name | Type | Description |
| service_http_request_count_total | Counter | Total number of HTTP requests made. |
| service_http_request_duration_seconds | Histogram | HTTP request latencies in seconds. |
| service_http_request_size_bytes | Summary | HTTP request sizes in bytes. |
| service_http_response_size_bytes | Summary | HTTP request sizes in bytes. |
???? Grafana
Although Promethues offers a simple dashboard, Grafana is clearly a better choice. Grafana configuration.