Hi there! This is an out of date post that we’ve kept around for transparency purposes. Learn more about the latest formula and see all the team’s current salaries here.
It’s been over 2 years since we first shared our transparent salary formula; we’ve been truly blown away by the response we’ve seen.
It’s been incredible to see how many companies have adopted our formula or a similar open formula, and it’s a privilege to be a small part of the larger conversation around pay transparency and equality.
It also kicked off a long list of other things that we wanted to make public. Here’s a roundup of things we’ve made transparent since then:
- Our company-wide equity breakdown
- Buffer’s pricing – where your money goes when you pay for Buffer
- Our real-time revenue
- Our values (and every change we make to them!)
- Our fundraising process, valuation and term-sheet
- Our team makeup and diversity
- And so much more!
You can get an overview of everything here.
Since we first launched our formula, a lot of things have evolved and changed at Buffer. We thought it was time for our salary formula to evolve, too.
This was a really fun process for us—we worked on this with the whole Buffer team for about 2-3 months (more on our detailed process on this further below!) and this is the result.
Today we’re excited to share a new (and, we believe, improved) version of our salary formula, along with a brand-new web app that anyone can use to find out what you would make if you were part of the team at Buffer.
Buffer’s new salary formula
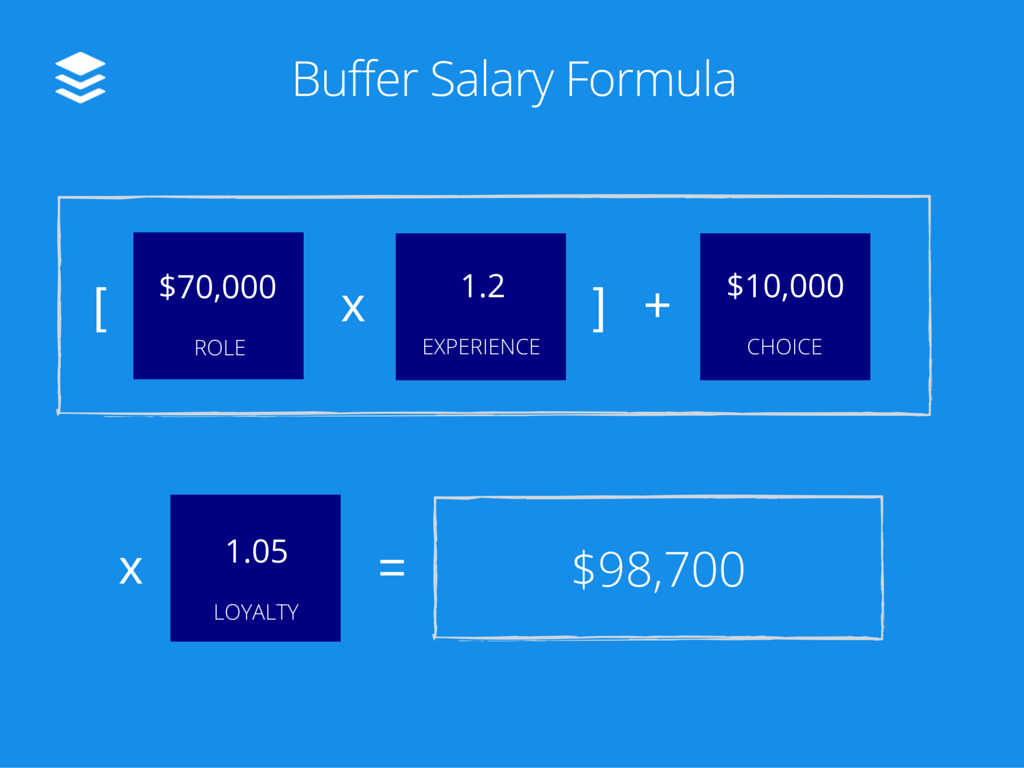
Our new formula looks like this:
Here’s a quick breakdown of each component:
Role: (overall base + location base + cost of living)* role value
The first, and biggest component for anyone’s salary is the role component. On the whole it consists of the following 4 factors:
- Overall base: For 35% of the base, we use standard U.S. data from both Payscale and Glassdoor to determine overall base.
- Location base: For the other 65% of the base, we factor in each location’s cost of living using Numbeo together with data from Payscale and Glassdoor, which we then use to have a base salary for that particular location (say New York or Cape Town).
- Cost of living correction: A 0ドル-8,000ドル addition to some salaries based on cost of living. We explain all about this one below in "The Good Life Curve" section – it’s an additional fixed value that can range from 0ドル-8,000ドル/year.
- Role value: A multiplier to adjust the overall salary. We don’t agree with the market salary data all the time (for customer service roles, for example) and so we create our own "role value adjustment" based off what we feel is fair. This can be an overall multiplier of 1.1x for example, or it can decrease for roles that aren’t exactly as described by Payscale and Glassdoor.
Experience: After we have your role base (above), we then apply the experience multiplier. There are 4 tiers as follows, which we determine through discussions with each team member:
- Beginner: 1x
- Intermediate: 1.1x
- Advanced: 1.2x
- Master: 1.3x
Dependents: For every person that depends on your income (kids, husbands, wives, significant others, grandparents, aunts and uncles, etc.) we add an extra 3,000ドル per year in salary.
Update January 2016: We now have a different method for supporting dependents that is not part of the salary formula; you can learn all about it here.
Loyalty: For every year a teammate is with us at Buffer, they’ll receive a general pay raise of 5%. This is applied on top of all of the above.
Choice: This is an option we give Buffer team members to either get extra salary or extra stock options in their compensation package. Right now, you can either add an extra 10,000ドル to your salary or skip the extra salary and get roughly 30% more stock options.
Here’s an example, putting all this together:
For an advanced engineer, living in Cape Town, who chooses more equity and has 2 kids and a husband depending on her income, this would be the result:
- 60,662ドル x 1.20 + 9,000ドル + 0ドル = 81,794ドル
A full list of all our salaries
Calculated with the new formula, here are the salaries of every team member at Buffer right now:
| Team Member | Role | Start Date | Location | Salary |
|---|---|---|---|---|
| Joel | CEO | 2010年08月01日 | New York, NY, USA | 218,000ドル |
| Leo | COO | 2011年01月03日 | New York, NY, USA | 185,000ドル |
| Andy | iOS Developer | 2012年06月01日 | San Francisco, CA, USA | 168,550ドル |
| Carolyn | CHO | 2012年09月01日 | New York, NY, USA | 140,932ドル |
| Sunil | CTO | 2012年09月18日 | Boston, MA, USA | 182,089ドル |
| Åsa | Customer Success Lead | 2013年02月18日 | New York, NY, USA | 121,090ドル |
| Colin | Backend/Frontend Developer | 2013年02月22日 | Cambridge, UK | 122,670ドル |
| Niel | Backend/Frontend Developer | 2013年08月15日 | Cape Town, SA | 101,141ドル |
| Mary | Happiness Hero | 2013年11月11日 | San Francisco, CA, USA | 92,108ドル |
| Adam | Happiness Hero | 2013年11月13日 | Detroit, MI, USA | 91,389ドル |
| Daniel | Happiness Hero | 2014年01月28日 | San Francisco, CA, USA | 80,974ドル |
| Courtney | Content Crafter | 2014年02月03日 | Nashville, TN, USA | 89,582ドル |
| Steven | Systems Engineer | 2014年02月03日 | Taipei, Taiwan | 98,175ドル |
| Dan | Backend/Frontend Developer | 2014年02月24日 | New York, NY, USA | 139,463ドル |
| Kevan | Content Crafter | 2014年03月06日 | Boise, ID, USA | 95,631ドル |
| Patrik | Customer Researcher | 2014年03月12日 | Knoxville, TN, USA | 98,112ドル |
| Dave | Happiness Hero | 2014年03月20日 | London, UK | 77,913ドル |
| Rodolphe | Operations Champion | 2014年04月07日 | Paris, France | 118,331ドル |
| Nicole | Community Champion | 2014年04月14日 | Portland, OR, USA | 88,861ドル |
| Octa | Happiness Hero | 2014年04月28日 | Miami, FL, USA | 70,621ドル |
| Michael | Backend/Frontend Developer | 2014年05月04日 | Santa Cruz, CA, USA | 151,078ドル |
| Tom | Android Developer | 2014年06月03日 | Toronto, Canada | 102,842ドル |
| Mike | Backend/Frontend Developer | 2014年07月14日 | Barcelona, Spain | 96,926ドル |
| José | Backend/Frontend Developer | 2014年12月01日 | Madrid, Spain | 86,549ドル |
| Tom D | Customer Researcher | 2014年12月15日 | Cambridge, UK | 81,415ドル |
| Eric | Systems Engineer | 2015年01月06日 | Beijing, China | 76,692ドル |
| Phil | Backend/Frontend Developer | 2015年02月09日 | New York, NY, USA | 128,740ドル |
| Maxime | Data Analyst | 2015年02月09日 | Montpellier, France | 94,291ドル |
| Dave O | Product Designer | 2015年03月03日 | Southowram, UK | 103,833ドル |
| Julian | Data Analyst | 2015年03月16日 | New York, NY, USA | 95,135ドル |
| Jim | Product Creator | 2015年04月16日 | Nashville, TN, USA | 134,215ドル |
| Danny | Happiness Hero | 2015年05月05日 | London, UK | 78,269ドル |
| Kat | Backend/Frontend Developer | 2015年05月11日 | Bristol, UK | 89,549ドル |
| Pioul | Backend/Frontend Developer | 2015年07月09日 | Grenoble, France | 95,215ドル |
| Marc Anthony | Product Creator | 2015年07月13日 | Houston, TX, USA | 119,548ドル |
| Steve | Product Designer | 2015年07月27日 | Timperley, UK | 94,177ドル |
| Ivana | Backend/Frontend Developer | 2015年08月10日 | Zadar, Croatia | 92,116ドル |
| Sandrine | Content Crafter | 2015年08月10日 | Paris, France | 81,780ドル |
| Kelly | Happiness Hero | 2015年08月17日 | Philadelphia, PA, USA | 75,934ドル |
| Ross | Happiness Hero | 2015年08月31日 | Louisville, KY, USA | 77,397ドル |
| Alex | Backend/Frontend Developer | 2015年09月01日 | Los Angeles, CA, USA | 111,696ドル |
| Marcus W | iOS Developer | 2015年09月02日 | Padova, Italy | 95,924ドル |
| Lorenz | Product Designer | 2015年09月08日 | Rotterdam, Netherlands | 90,324ドル |
| Roy | Customer Researcher | 2015年09月10日 | Saint Catharines, Canada | 103,133ドル |
| Alfred | Community Champion | 2015年09月14日 | Singapore | 59,112ドル |
| Jordan | iOS Developer | 2015年09月23日 | Ozark, MO, USA | 110,636ドル |
| Kyle | Product Creator | 2015年09月28日 | Portland, OR, USA | 116,243ドル |
| Amy | Happiness Hero | 2015年10月01日 | San Francisco, CA, USA | 77,118ドル |
| James | Product Designer | 2015年10月05日 | Berlin, Germany | 95,538ドル |
| Ash | Content Crafter | 2015年10月05日 | Bury St Edmunds, UK | 80,518ドル |
| Matt | Data Analyst | 2015年10月12日 | Boulder, CO, USA | 95,185ドル |
| Mike E | Customer Researcher | 2015年10月14日 | Sydney, Australia | 82,992ドル |
| Humberto | iOS Developer | 2015年10月14日 | Asuncion, Paraguay | 76,160ドル |
| Arielle | Community Champion | 2015年10月26日 | Philadelphia, PA, USA | 67,418ドル |
| Deb | Culture Scout | 2015年10月27日 | London, UK | 86,423ドル |
| Karim | Finance Planner | 2015年11月01日 | Växjo, Sweden | 106,628ドル |
| Marcus S | Marketing Specialist | 2015年11月03日 | Nashville, TN, USA | 72,124ドル |
| Todd | Happiness Hero | 2015年11月05日 | Louisville, KY, USA | 64,397ドル |
| Bob | Happiness Hero | 2015年11月05日 | Medford, OR, USA | 67,099ドル |
| Boris | Backend/Frontend Developer | 2015年11月09日 | Montpellier, France | 91,186ドル |
| Juliet | Happiness Hero | 2015年11月09日 | London, UK | 71,203ドル |
| Federico | Backend/Frontend Developer | 2015年11月09日 | Milan, Italy | 89,308ドル |
| Kieran | Backend/Frontend Developer | 2015年11月16日 | Sydney, Australia | 95,287ドル |
| Hannah | Happiness Hero | 2016年01月04日 | Brighton, UK | 66,002ドル |
| Darcy | Twitter Hero | 2015年11月17日 | Fort Collins, CO | 70,193ドル |
Check out our working salaries spreadsheet to get more information about how each salary is derived.
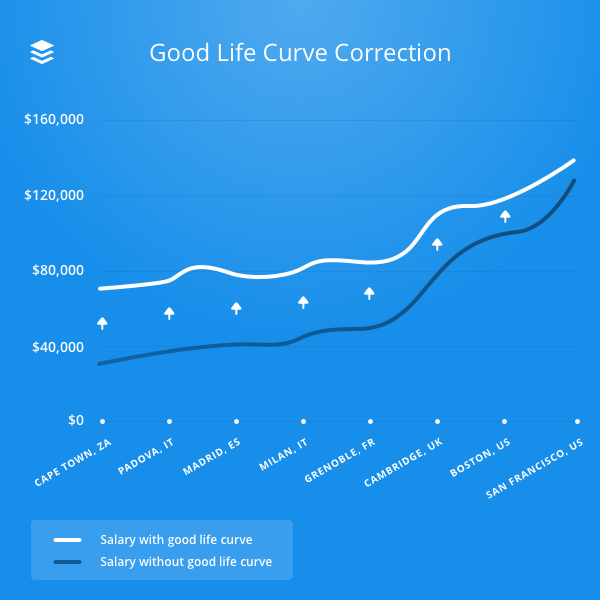
Introducing "The Good Life Curve"
This is one of the things we’re the most excited about for this salary iteration, and it has created some of the biggest changes of this formula.
Here was the problem: Our previous formula took into account the cost of living in a city, but not the market rate. For example, San Francisco and London were both considered at the same level previously since they have a similar cost of living, but have very different job markets.
When we first started doing this, we noticed that relying purely on market data would create a huge salary disparity. For example, there would be a 90,000ドル wage gap from Cape Town to San Francisco. We didn’t want that big of a gap for a number of reasons.
To mitigate this, we created a formula that ‘corrects’ this. We call this the "Good Life Curve."
The new formula now includes an elastic part that adjusts to the cost of living and market influence of salaries for different roles.
These are some of the key reasons that triggered us to come up with The Good Life Curve:
- Buffer is not a San Francisco company, neither is it a Cape Town company—instead, it is a distributed company that operates in both places and many, many others as well. So we don’t want to blindly adjust to market rates and instead create our own rates that include this "remote" aspect in some way.
- We believe that everyone should be able to live a good life—and we don’t want to exploit people living in places where wages are generally lower. We’re not an outsourcing company. Therefore, we decided to create a significant lift in salaries for those that live in places that are generally much lower paid compared to the average.
- We don’t want to have such a stark wage gap between team members in general. Even though a certain gap is inevitable and good, if someone in the same role, with similar experience, is making 100ドルk less, that feels unfair in the grand scheme of things.
- The value that someone in San Francisco creates for Buffer is not different compared to the value a teammate in Cape Town creates. The only difference is that someone in Cape Town might have higher purchasing power, which should be the only driver of salary difference between the two.
We hope that the Good Life Curve offers a happy life to every teammate!
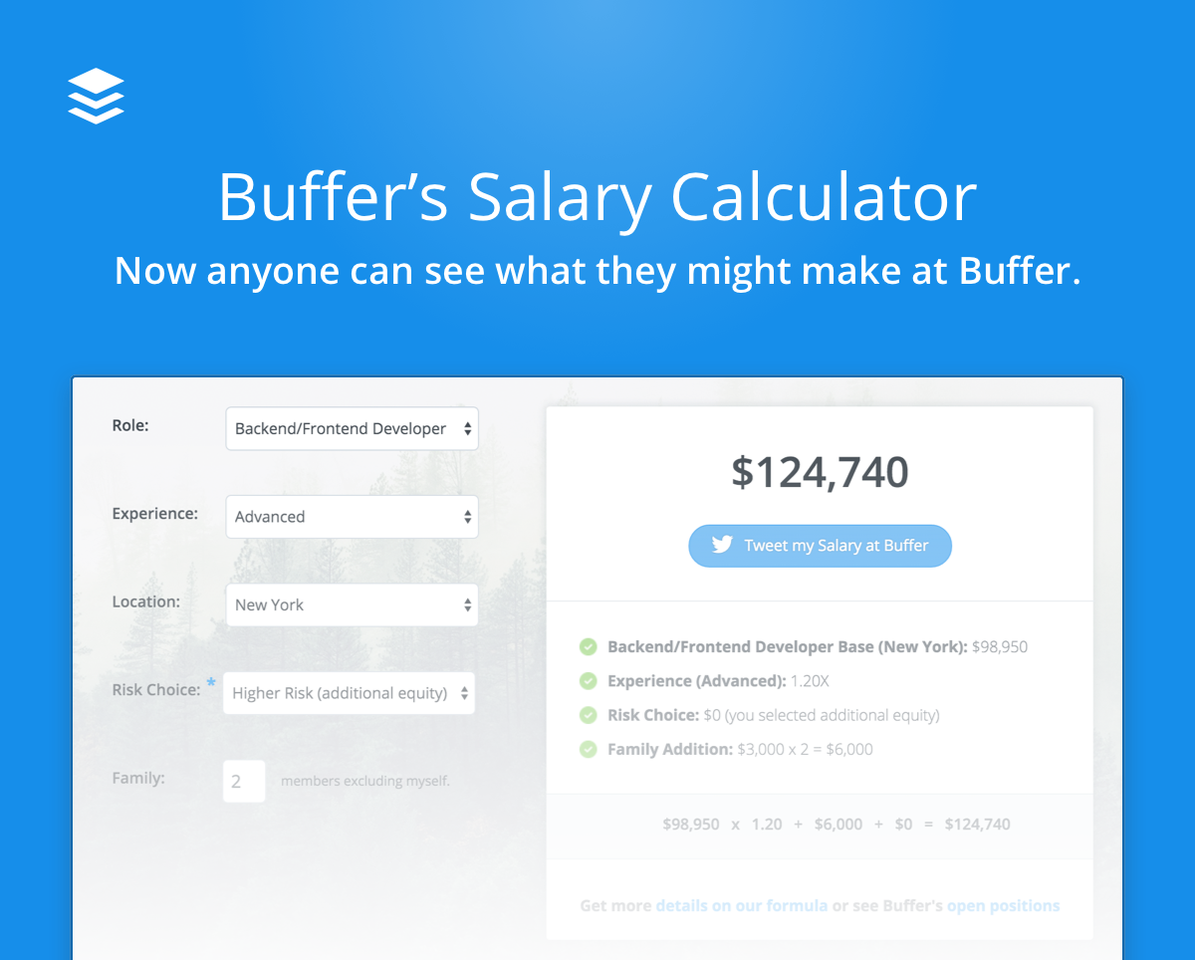
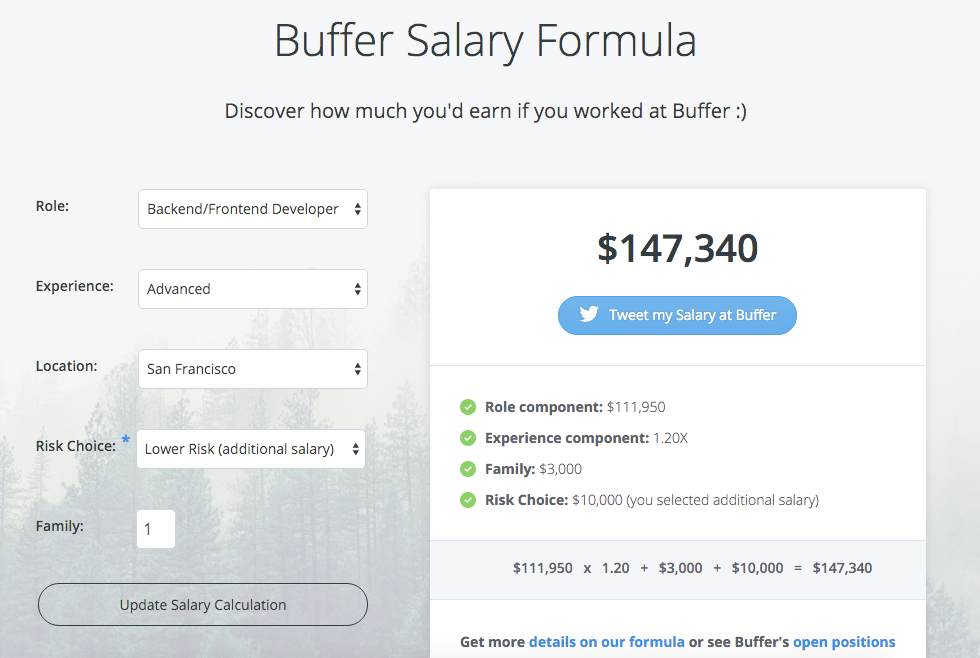
The Transparent Buffer Salary Calculator: Try it for yourself!
With weighting, multipliers and now The Good Life Curve, all of the various elements of the salary formula can get a bit tricky to explain as we grow the team quickly.
So we created The Transparent Buffer Salary Calculator. This means that now anyone can see what they might make at Buffer by plugging in their own data for location, experience and so forth.
For instance, an advanced-level developer living in San Francisco might enter this into the salary calculator:
We break out for you each individual component so it’s simpler to understand how every element of the formula works together to create the overall salary.
Even though our formula has become more comprehensive, we hope that the calculator will make getting results easy. We were so blown away by how many startups have adopted our salary formula, and we want to keep making it simple for anyone to make use of our latest data.
On top of that, we’re of course excited to make great use of the calculator internally as we bring new people on board and give them fair and accurate salaries they can easily understand.
What isn’t in this iteration of our formula (and what’s next)
As we grow and evolve, our salary formula naturally needs to become a lot more comprehensive; and we feel it has turned into something that’s pretty solid now.
However, there are quite a few elements that are not included in this formula:
- Experience: We’re using a very primitive approach to the experience component right now. It scales only across four bands: Beginner, Intermediate, Advanced, and Master. And it’s not a very accurate process in how we arrive there. More or less, we make a call and ask people how they feel about it. That’s not great, and we’re keen to improve this. It feels really important to measure people’s experience more accurately, and indicate how people can progress and be compensated for that progress. This is #1 on our list.
- Taxes: We’re a distributed team, and taxes vary greatly by country. Even though the top-line salary might be easy to compare, the take-home pay might be quite different. We know, for example, that Buffer team members in France pay a lot of extra taxes that others don’t. This would be another great one to improve on.
- Nomading: Another element of being a distributed team is that people are free to move around as much as they want. That’s usually a heavier burden in terms of costs, and we’re generally keen to support people in finding the place where they feel happiest and want to live. It’s something that isn’t accounted for either in the current formula and something we’re keen to dive in deeper on.
- Exchange rate changes: Especially with the recent Euro/USD change, a lot of teammates’ salaries in Europe have gone up a lot. However if the opposite was the case, this might be more of a challenge.
- Salary vs equity choice: When you join Buffer full-time, you decide whether you want more salary or more equity in your compensation package. Right now, you can get either 10,000ドル in extra salary or you can get 30% more stock options. That’s an option that has become a bit outdated as Buffer’s overall valuation has gone up and it’s no longer that attractive to get extra equity. This is another key iteration we’ve already started to work on.
Thanks for the amazing input, and let us know more thoughts!
It’s amazing to come across so many people who have been inspired by the original formula and implemented it for their own company.
For anyone looking to take a job at a startup, or anyone working on salaries at a startup, we hope this new formula and calculator might cut down the time you spend on thinking about salaries by many hours.
And even though we’ve thought about this formula for many months, it’s far from perfect. It’s going to have a ton of flaws and mistakes, and it’s exciting to share it with you to get feedback and insights we can use for the next version.
For a deeper dive into some of the philosophy and tactics involved in this version of our salary formula, we sat down for a chat with Courtney about the thoughts and process involved in creating it. You can watch the whole chat here:
There are many reasons why we believe salary transparency is such a powerful force, and we’re humbled and excited to keep iterating in this area, and keep starting conversations that can have an impact on the industry.
Hit us up in the comments below, we’d love to hear your thoughts and discuss.
Joel and Leo, Buffer Co-founders
Try Buffer for free
190,000+ creators, small businesses, and marketers use Buffer to grow their audiences every month.