This site needs JavaScript to work properly. Please enable it to take advantage of the complete set of features!
Skip to main page content
U.S. flag

An official website of the United States government

Dot gov

The .gov means it’s official.
Federal government websites often end in .gov or .mil. Before sharing sensitive information, make sure you’re on a federal government site.

Https

The site is secure.
The https:// ensures that you are connecting to the official website and that any information you provide is encrypted and transmitted securely.

NIH NLM Logo
Log in
Access keys NCBI Homepage MyNCBI Homepage Main Content Main Navigation
. 2024 Feb 26;25(1):56.
doi: 10.1186/s13059-024-03183-0.

A comparison of marker gene selection methods for single-cell RNA sequencing data

Affiliations

A comparison of marker gene selection methods for single-cell RNA sequencing data

Jeffrey M Pullin et al. Genome Biol. .

Abstract

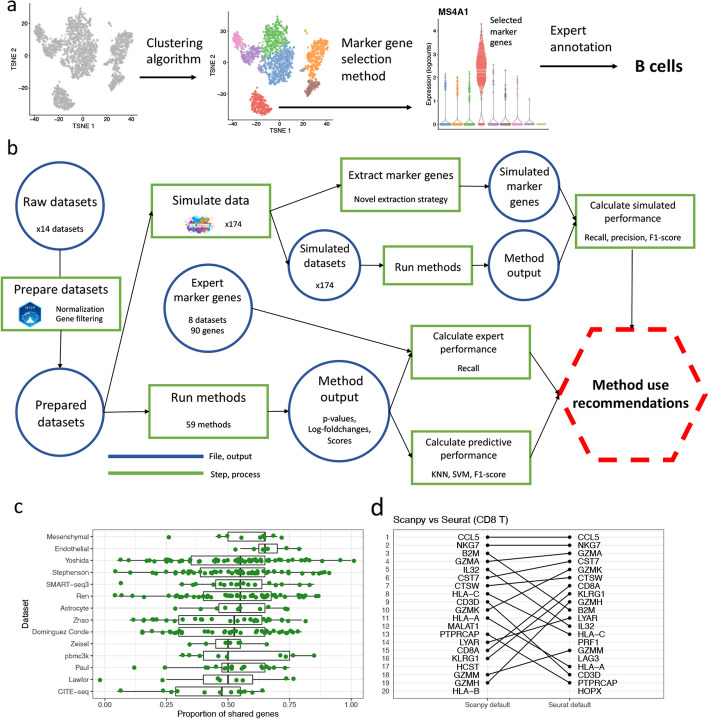
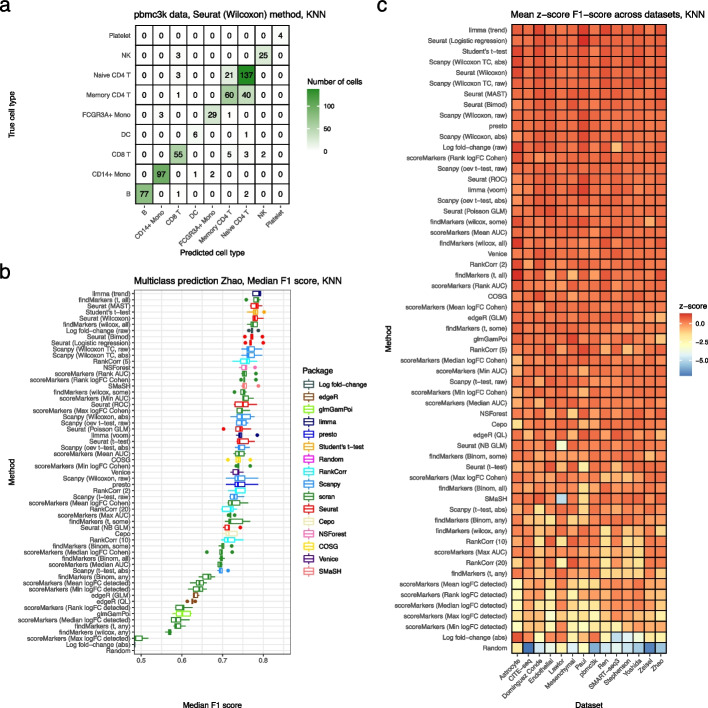
Background: The development of single-cell RNA sequencing (scRNA-seq) has enabled scientists to catalog and probe the transcriptional heterogeneity of individual cells in unprecedented detail. A common step in the analysis of scRNA-seq data is the selection of so-called marker genes, most commonly to enable annotation of the biological cell types present in the sample. In this paper, we benchmark 59 computational methods for selecting marker genes in scRNA-seq data.

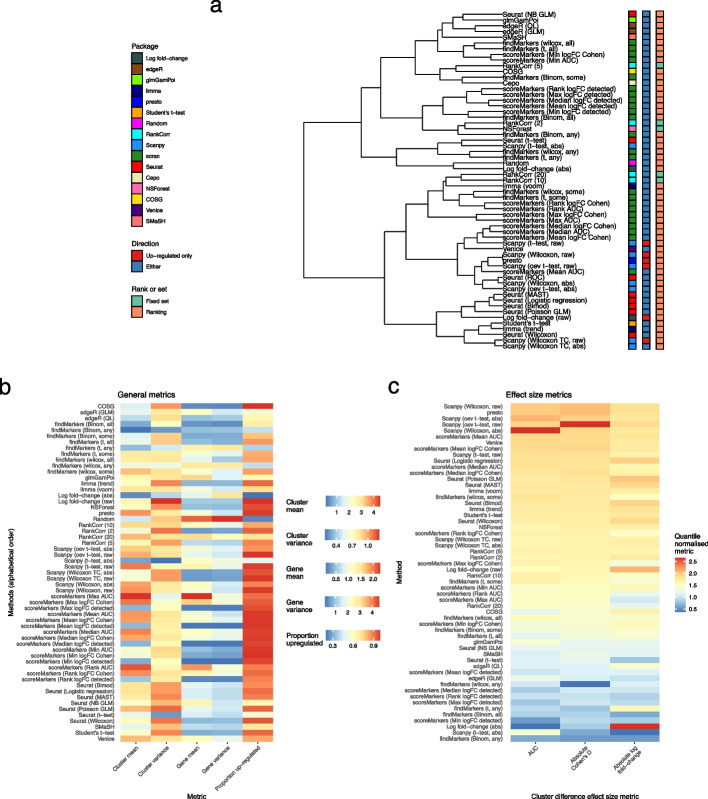
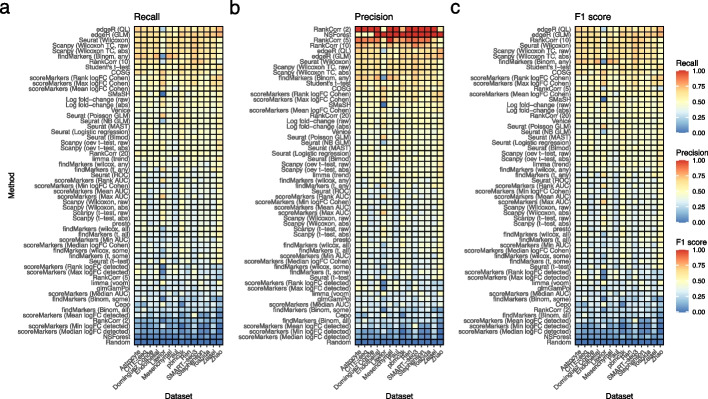
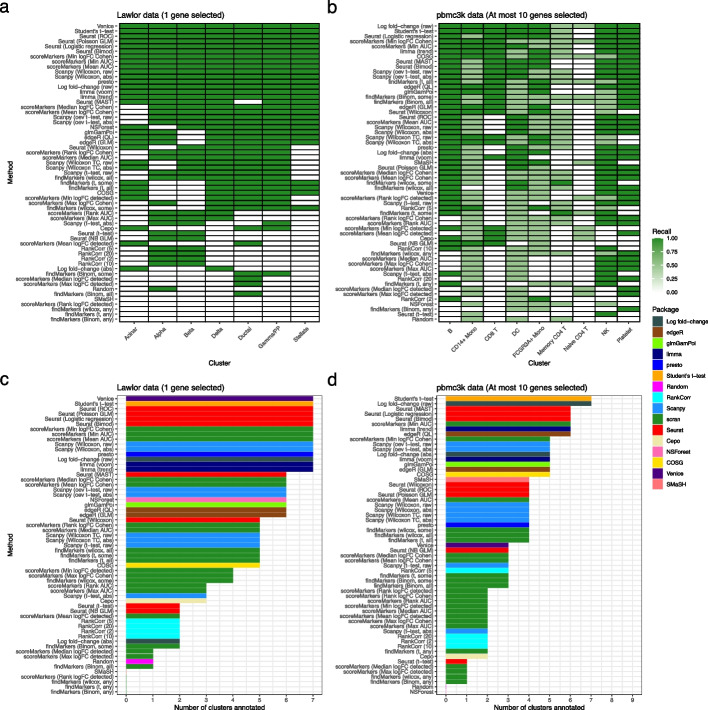
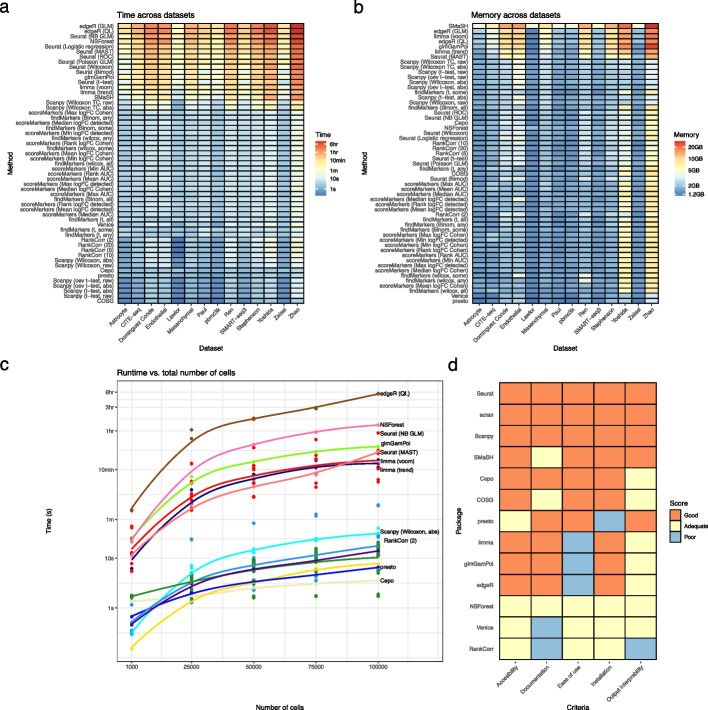
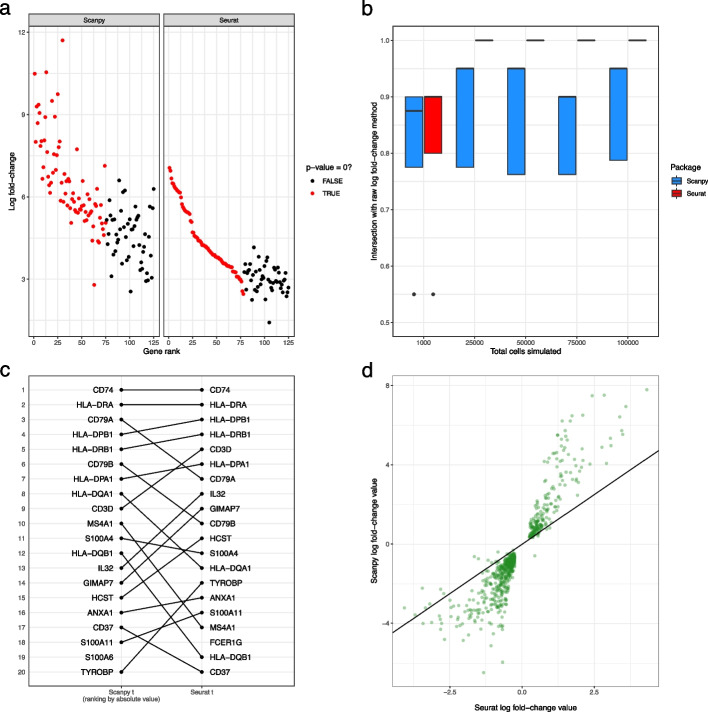
Results: We compare the performance of the methods using 14 real scRNA-seq datasets and over 170 additional simulated datasets. Methods are compared on their ability to recover simulated and expert-annotated marker genes, the predictive performance and characteristics of the gene sets they select, their memory usage and speed, and their implementation quality. In addition, various case studies are used to scrutinize the most commonly used methods, highlighting issues and inconsistencies.

Conclusions: Overall, we present a comprehensive evaluation of methods for selecting marker genes in scRNA-seq data. Our results highlight the efficacy of simple methods, especially the Wilcoxon rank-sum test, Student's t-test, and logistic regression.

Keywords: Benchmarking; Bioinformatics; Single-cell.


Conflict of interest statement

While this manuscript was under consideration for publication DJM became an Editorial Board member of Genome Biology. JMP declares no competing interests.

Figures

Fig. 1
Fig. 1
Overview of marker genes usage and benchmarking. a A visual overview of the use of marker genes to annotate clusters. First, a clustering algorithm is performed to separate cells into putative clusters. Then, for each cluster, a marker gene selection method is used extract a small number of marker genes. This gene list is inspected and the expression of the genes visualized to give an expert-annotation of cell type for each cluster. b A visual overview of the benchmarking performed in this paper. First, the real datasets are processed and the marker gene selection methods are run on the processed datasets. The output of the methods is extracted and used to calculate the methods’ predictive performance and ability to recover expert-annotated marker genes. The processed datasets are also used to simulate additional datasets, on which the methods are run and their ability to recover true simulated marker genes calculated. c The proportion of shared genes in the top 20 genes selected by the default methods implemented by Scanpy and Seurat for each cluster across 10 real datasets (127 clusters in total). d A visual comparison of the rankings of the top 20 selected genes by the default Scanpy and Seurat methods in the CD8 T cell cluster in the pbmc3k dataset
Fig. 2
Fig. 2
Method concordance and output characteristics. a A dendrogram representation of the hierarchical clustering of methods based on the proportion of shared genes in the at most top 20 genes they select. Methods are labeled by the package which implements them, whether they select only up-regulated marker genes or both up- and down-regulated marker genes, and whether they output a set of marker genes or a ranking of genes by strength of marker gene status. b A variety of features summarizing (averaging over datasets) the characteristics of the at most top 5 marker genes methods select. Methods are sorted by alphabetical order. c Three features (Area under the curve, log fold-change and Cohen’s d) summarizing (averaging over datasets) the one-vs-rest effect size of the at most top 5 marker genes that methods select. The three features are quantile normalized and methods are ranked by the median score across datasets
Fig. 3
Fig. 3
Comparison of methods using simulated datasets. a Calculated recall for all methods on simulation scenarios based on all real datasets. The marker genes selected based on the simulation model parameters are used as the ground truth. Methods are ranked top to bottom in the heatmap by median recall across scenarios. b As in (a) but now with precision. c As in (b) but calculating F1 score. These results average over simulated clusters and simulation replicates and are conducted with 20 genes selected and a location parameter for the DE factor in the splat simulation model of 3
Fig. 4
Fig. 4
Comparison of methods based on expert-annotated marker genes. a Recall of methods when selecting marker genes in the Lawlor dataset using a set of expert-annotated marker genes as the ground truth. The marker genes used to annotate the clustering in the original publication describing the Lawlor dataset were used as the set of expert-annotated marker genes. The top gene was selected from the output of each method. b As in (a) but for the pbmc3k dataset, using the (at most) top 10 marker genes from each method and taking the set of expert-annotated marker genes to be those used in the Seurat package’s "Guided Clustering Tutorial." c The number of clusters that are successfully annotated using the selected marker genes in the Lawlor datasets (other details as in a). A specific cluster is defined as successfully annotated if the selected marker genes include all the expert-annotated marker genes for that cluster. d The same success of annotation analysis as in (c) but for the pbmc3k dataset, with the details of the expert-annotated marker genes and number of selected marker genes as in (b)
Fig. 5
Fig. 5
Comparison of methods using predictive performance. a A confusion matrix representation of the performance of a KNN (three nearest neighbors) classifier using the set of genes selected by the Seurat Wilcoxon method in the pbmc3k dataset. b Median F1 score of the KNN classifier using genes selected by all marker gene selection methods in the Zhao dataset. Each point is the F1 score in one of the 5 folds. c The z-score of the median F1 score of the KNN classifier (averaging across folds) in each dataset. Methods are ranked top to bottom by their mean z-score across datasets
Fig. 6
Fig. 6
Comparisons of methods' computational performance and implementation quality. a Heatmap displaying the time taken for all methods to run across all 10 real datasets. Methods are ranked top to bottom in the heatmap by median time taken over datasets, largest at the top. Note that the color scale of the heatmap is a log scale. b Heatmap displaying the memory usage of all methods across all datasets. Methods are ranked top to bottom in the heatmap by median memory usage over datasets, largest at the top. c Time taken for all methods on simulated datasets with increasing numbers of total cells. Points are averages over 3 simulation replicates. All simulations had parameters estimated from the pbmc3k dataset and a location parameter for the DE factor of 3. d Assessment of the implementation quality of packages which implement methods for selecting marker genes based on 5 criteria
Fig. 7
Fig. 7
Case studies scrutinizing Scanpy and Seurat. a Gene rank vs log fold-change values for the Scanpy Wilcoxon (with tie correction, ranking by the absolute value of the score) and Seurat Wilcoxon methods for the Oligodendrocyte cell type cluster in the Zeisel dataset. The color of the point indicates whether or not the gene has an exactly zero p-value. b The proportion of top 20 genes shared between methods implemented in Scanpy and Seurat and the method of ranking genes by the raw log fold-change calculation on simulated datasets with increasing number of total cells. These simulations have parameters estimated from the pbmc3k dataset and a location parameter for the DE factor of 3. c Visualization of difference in rankings between the Scanpy t method (ranking by the absolute value of the score) and Seurat’s t-test method on the B cell cluster in the pbmc3k dataset. d Scatter plot between the log fold-change values calculated by Seurat and Scanpy on the B cell cluster in the pbmc3k dataset

References

    1. Svensson V, da Veiga Beltrame E, Pachter L. A Curated Database Reveals Trends in Single-Cell Transcriptomics. Database. 2020;2020(baaa073). 10.1093/database/baaa073. - PMC - PubMed
    1. Zappia L, Phipson B, Oshlack A. Exploring the Single-Cell RNA-seq Analysis Landscape with the scRNA-tools Database. PLoS Comput Biol. 2018;14(6):e1006245. doi: 10.1371/journal.pcbi.1006245. - DOI - PMC - PubMed
    1. Zappia L, Theis FJ. Over 1000 Tools Reveal Trends in the Single-Cell RNA-seq Analysis Landscape. Genome Biol. 2021;22(1):301. doi: 10.1186/s13059-021-02519-4. - DOI - PMC - PubMed
    1. Crowell HL, Soneson C, Germain PL, Calini D, Collin L, Raposo C, et al. Muscat Detects Subpopulation-Specific State Transitions from Multi-Sample Multi-Condition Single-Cell Transcriptomics Data. Nat Commun. 2020;11(1):6077. doi: 10.1038/s41467-020-19894-4. - DOI - PMC - PubMed
    1. van der Wijst M, de Vries D, Groot H, Trynka G, Hon C, Bonder M, et al. The Single-Cell eQTLGen Consortium. eLife. 2020;9:e52155. doi: 10.7554/eLife.52155. - DOI - PMC - PubMed

Publication types

LinkOut - more resources

Cite

AltStyle によって変換されたページ (->オリジナル) /