This site needs JavaScript to work properly. Please enable it to take advantage of the complete set of features!
Skip to main page content
U.S. flag

An official website of the United States government

Dot gov

The .gov means it’s official.
Federal government websites often end in .gov or .mil. Before sharing sensitive information, make sure you’re on a federal government site.

Https

The site is secure.
The https:// ensures that you are connecting to the official website and that any information you provide is encrypted and transmitted securely.

NIH NLM Logo
Log in
Access keys NCBI Homepage MyNCBI Homepage Main Content Main Navigation
. 2023 Sep 6;14(1):5478.
doi: 10.1038/s41467-023-41237-2.

Evolutionary selection of proteins with two folds

Affiliations

Evolutionary selection of proteins with two folds

Joseph W Schafer et al. Nat Commun. .

Abstract

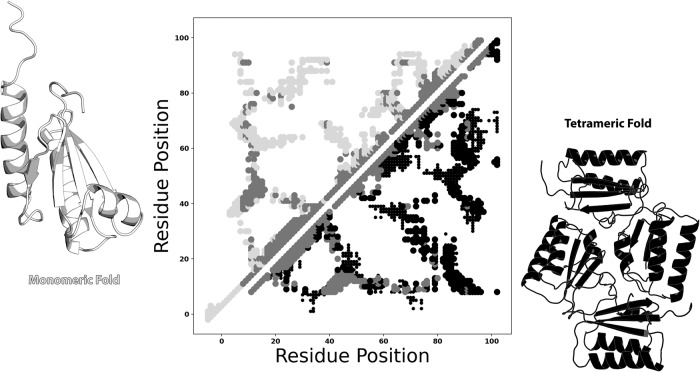
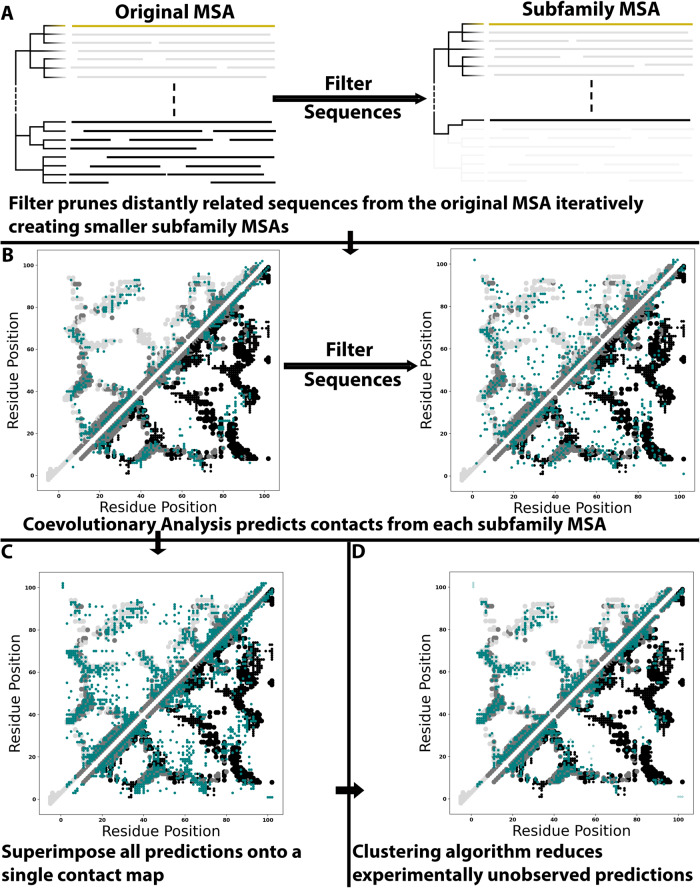
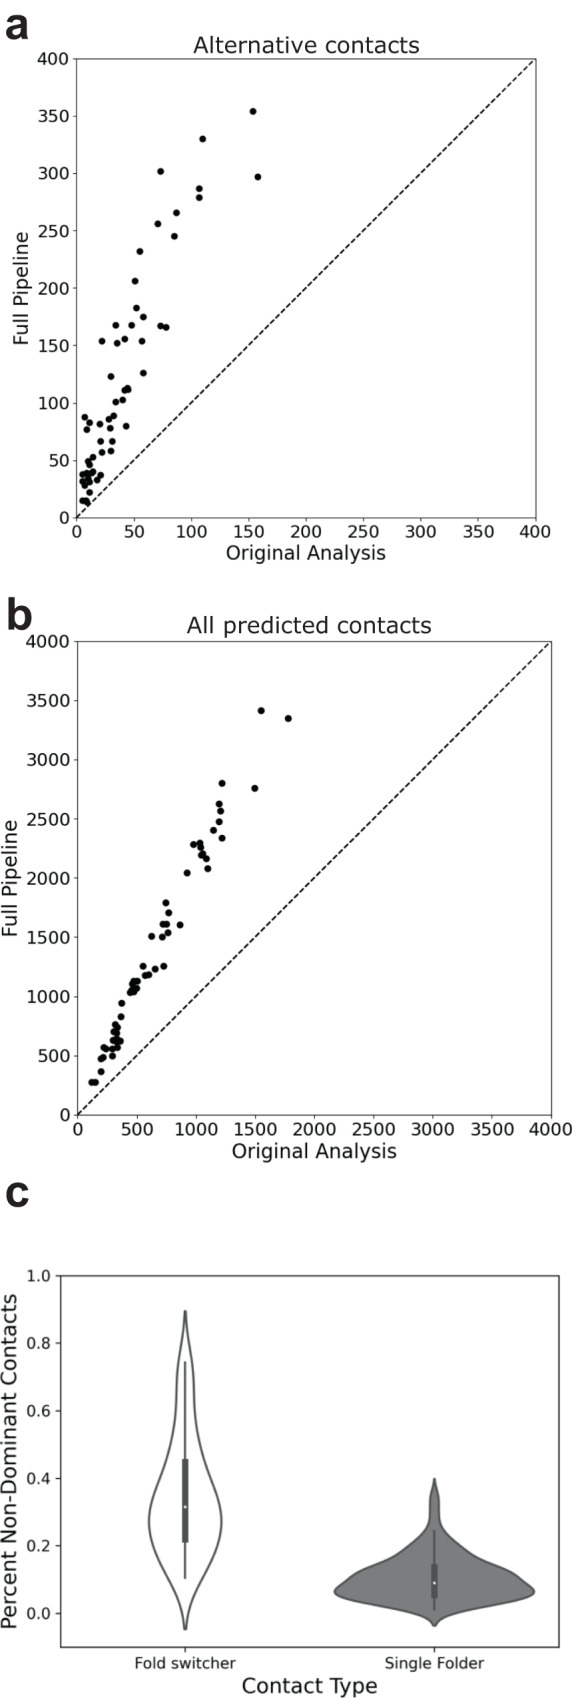
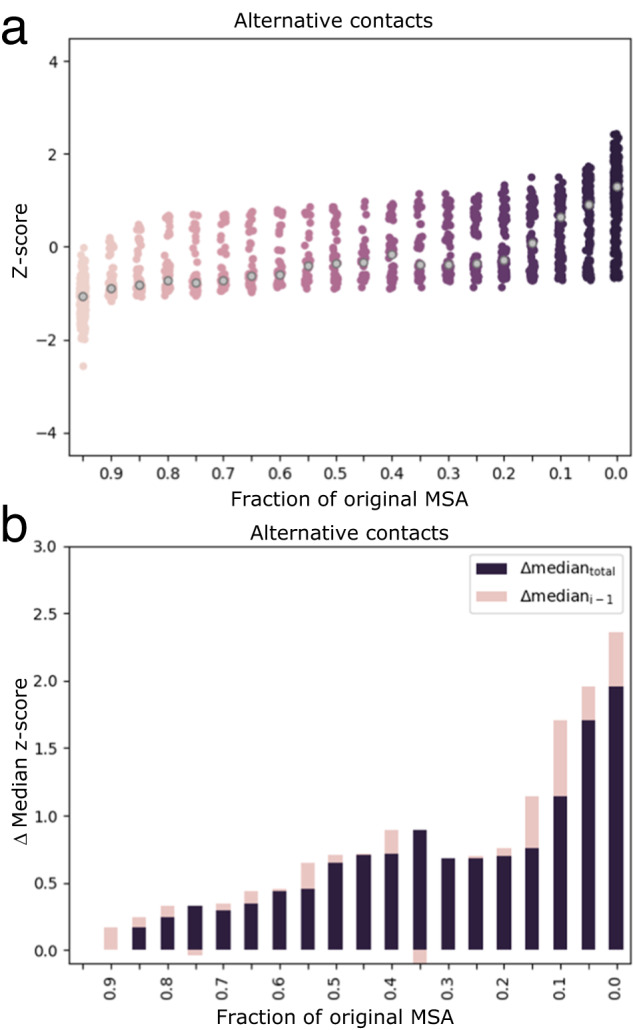
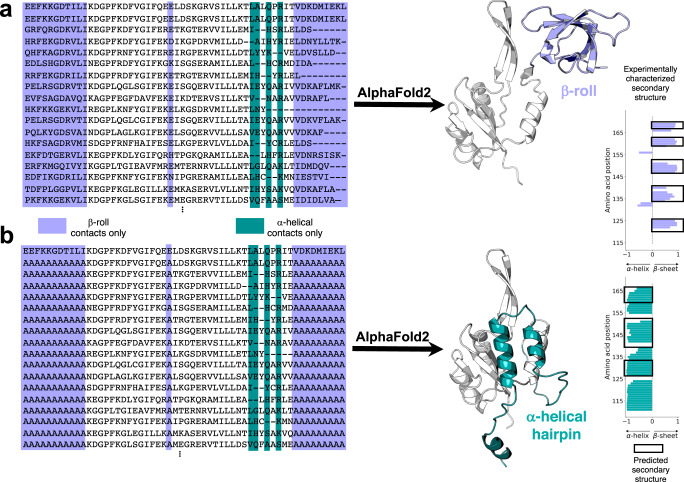
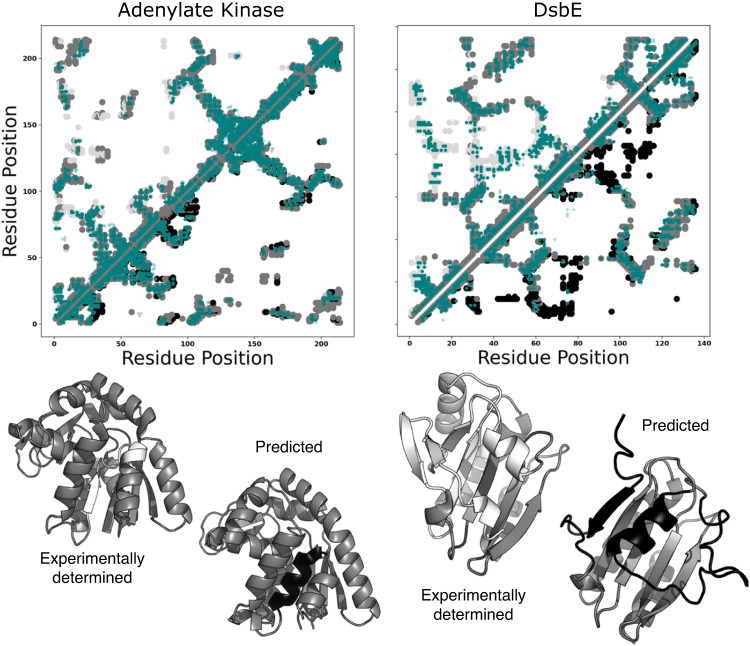
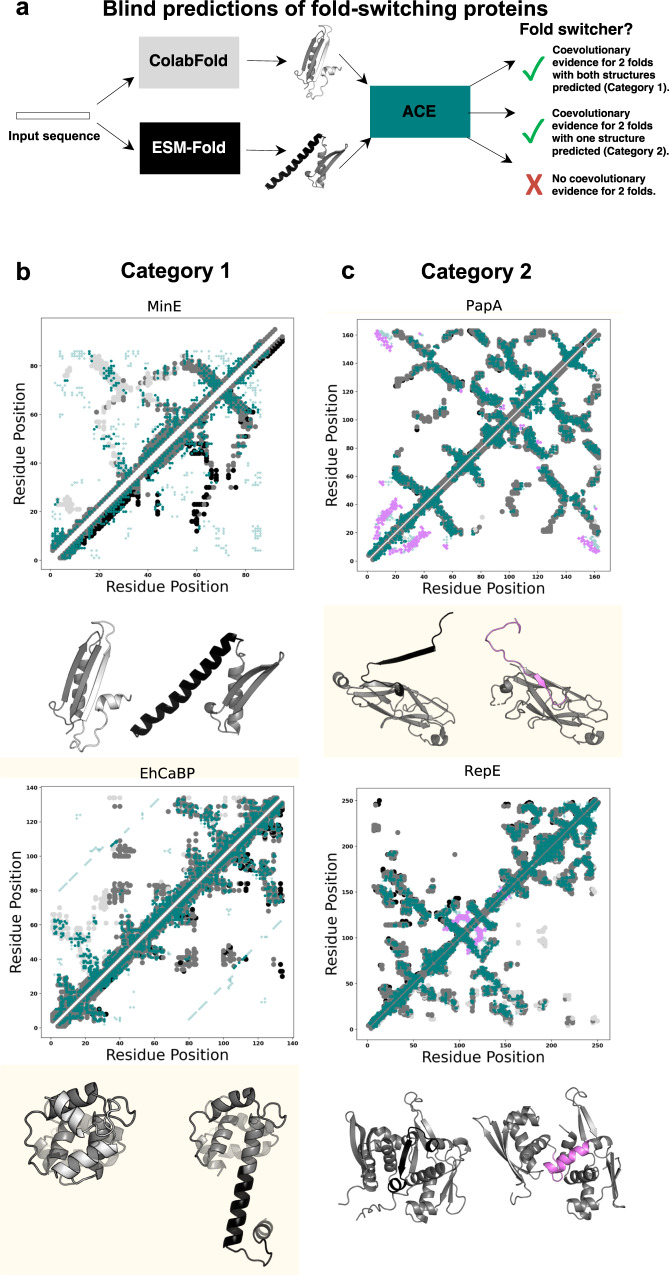
Although most globular proteins fold into a single stable structure, an increasing number have been shown to remodel their secondary and tertiary structures in response to cellular stimuli. State-of-the-art algorithms predict that these fold-switching proteins adopt only one stable structure, missing their functionally critical alternative folds. Why these algorithms predict a single fold is unclear, but all of them infer protein structure from coevolved amino acid pairs. Here, we hypothesize that coevolutionary signatures are being missed. Suspecting that single-fold variants could be masking these signatures, we developed an approach, called Alternative Contact Enhancement (ACE), to search both highly diverse protein superfamilies-composed of single-fold and fold-switching variants-and protein subfamilies with more fold-switching variants. ACE successfully revealed coevolution of amino acid pairs uniquely corresponding to both conformations of 56/56 fold-switching proteins from distinct families. Then, we used ACE-derived contacts to (1) predict two experimentally consistent conformations of a candidate protein with unsolved structure and (2) develop a blind prediction pipeline for fold-switching proteins. The discovery of widespread dual-fold coevolution indicates that fold-switching sequences have been preserved by natural selection, implying that their functionalities provide evolutionary advantage and paving the way for predictions of diverse protein structures from single sequences.


Conflict of interest statement

The authors declare no competing interests.

Figures

Fig. 1
Fig. 1. Example of a dual fold contact map from experimentally determined structures.
KaiB monomeric/tetrameric heavy-atom contacts within 8 Å are shown in the upper/lower triangles of the contact map in light gray/black. Contacts common to both folds are shown in medium gray. Interchain contacts within 10 Å are shown as smaller circles in their respective colors. Monomeric/tetrameric contacts were calculated from PDBs 1T4Y/4KSO. Protein structures were generated with PyMOL. Plots in all figures were generated with Matplotlib. Source data are provided as a Source Data file.
Fig. 2
Fig. 2. Graphical depiction of Alternative Contact Enhancement (ACE), using KaiB as an example input.
A An MSA suitable for coevolutionary analysis is pruned by the identity of its sequences to the query sequence (yellow), removing distantly related sequences from the dataset and generating subfamily-specific MSAs. B Each MSA (original + all pruned) is used as input for coevolutionary analysis. C Predictions from all MSAs are superimposed on a single contact map. D A clustering algorithm filters noise, leaving dense clusters of predicted amino acid contacts. Contacts unique to the dominant/alternative folds are light gray/black; common contacts are light gray; experimentally consistent predictions are teal circles; incorrect predictions (noise) are translucent teal diamonds. Figure 1 provides an explanation of the dual-fold contact maps used here. Source data are provided as a Source Data file.
Fig. 3
Fig. 3. ACE amplifies correctly predicted contacts for fold-switching proteins.
Amplification is observed for 56/56 predicted contacts uniquely corresponding to the alternative fold (a) and for all predicted contacts (b). Identity lines in both plots are dashed lines. c Amplification of alternative contacts occurs much more frequently in fold switchers than among single folders. Violin plots show the distributions of %non-dominant contacts for fold-switching and single-fold proteins. The left and right distributions were generated from n = 56 and n = 181 datapoints, respectively. Inner bold black boxes span the interquartile ranges (IQRs) of each distribution (first quartile, Q1 through third quartile, Q3); medians of each distribution are white dots, lower line (whisker) is the lowest datum above Q1-1.5*IQR; upper line (whisker) is the highest datum below Q3 + 1.5*IQR. Source data are provided as a Source Data file.
Fig. 4
Fig. 4. Alternative contacts are enhanced largely by subfamily-specific MSAs.
a Z-scores of predicted alternative contacts increase as MSAs become shallower and more similar to the fold-switching sequence of interest. Median z-scores of each bin are gray. b Z-scores of predicted contacts change most in deepest and shallowest MSAs. Purple bars are differences between median z-score of bin (gray dots in (a)) and median z-score of the deepest MSA. Pink bars are differences between median z-score of bin and median z-score of next deepest bin. Source data are provided as a Source Data file.
Fig. 5
Fig. 5. AlphaFold2 successfully predicts two conformations of a candidate sequence without experimentally determined structures.
a A NusG N-terminal (NGN) fold (light gray) and a C-terminal β-roll fold (lavender) are predicted from a deep input MSA (region corresponding to the CTD shown). Predicted β-sheets in the C-terminal domain that agree closely with the β-sheets predicted from nuclear magnetic resonance experiments are shown with black boxes surrounding lavender bars. b A NusG N-terminal (NGN) fold (light gray) and a C-terminal α-helical hairpin fold (teal) are predicted from a modified input MSA in which columns predicted to form only β-roll contacts are changed to alanine. Predicted α-helices in the C-terminal domain that agree with the α-helices predicted from nuclear magnetic resonance experiments are shown with black boxes surrounding teal bars. Protein structures were generated with PyMOL. Source data are provided as a Source Data file.
Fig. 6
Fig. 6. Some AlphaFold2 fold-switch predictions based on modified multiple sequence alignments (MSAs) lack strong coevolutionary signatures.
Contact maps of Adenylate Kinase (left) and DsbE (right) show the experimentally determined structure on the top diagonal and the AF2-predicted fold switched structure on the bottom. Many predicted coevolved contacts (teal) overlap with contacts unique to the experimentally determined structures (light gray), but few overlap with contacts unique to the alternative structures predicted by AlphaFold2 (black). Structures of both sets of conformations are shown below their respective contact maps. Medium gray regions are common to both folds; white/black correspond to experimentally determined/AF2 prediction. PDB IDs for experimentally determined structures are 4AKE, chain A and 1LU4, chain A, for adenylate kinase and DsbE, respectively. Figure 1 provides an explanation of the dual-fold contact maps used here. Source data are provided as a Source Data file.
Fig. 7
Fig. 7. Blind predictions of fold-switching proteins.
a Blind predictions are performed by using ColabFold and ESMFold to each predict a structure of an amino acid sequence. ACE predicts coevolved residue pairs using the two predicted structures as references. The predicted structures are compared. Different structure predictions both consistent with coevolutionary predictions fall into Category 1 (b). Examples include the cell division protein MinE and the EF-hand protein EhCaBP. Similar structure predictions with coevolutionary evidence fall into Category 2 (c). Examples include the bacterial pilin protein PapA and the DNA replicase, RepE. For Figures (b) and (c), contact maps are shown above structures predicted by ColabFold (fold-switching regions light gray) and ESMFold (fold-switching regions black). Predicted contacts are teal. In (c) ColabFold and ESMFold predict the same conformation. Predicted contacts corresponding to the experimentally characterized alternative conformation are light purple. Structurally conserved protein regions/common contacts are medium gray. Although all proteins are presented as monomers for simplicity, MinE forms a dimer and PapA forms large oligomers. Figure 1 provides an explanation of the dual-fold contact maps used here. Source data are provided as a Source Data file.

Update of

References

    1. Baek M, et al. Accurate prediction of protein structures and interactions using a three-track neural network. Science. 2021;373:871–876. doi: 10.1126/science.abj8754. - DOI - PMC - PubMed
    1. Jumper J, et al. Highly accurate protein structure prediction with AlphaFold. Nature. 2021;596:583–589. doi: 10.1038/s41586-021-03819-2. - DOI - PMC - PubMed
    1. Lin Z, et al. Evolutionary-scale prediction of atomic-level protein structure with a language model. Science. 2023;379:1123–1130. doi: 10.1126/science.ade2574. - DOI - PubMed
    1. David A, Islam S, Tankhilevich E, Sternberg MJE. The AlphaFold Database of Protein Structures: a biologist’s guide. J. Mol. Biol. 2021;434:167336. doi: 10.1016/j.jmb.2021.167336. - DOI - PMC - PubMed
    1. Outeiral, C., Nissley, D. A. & Deane, C. M. Current structure predictors are not learning the physics of protein folding. Bioinformatics10.1093/bioinformatics/btab881 (2022). - PMC - PubMed

Publication types

Cite

AltStyle によって変換されたページ (->オリジナル) /