This site needs JavaScript to work properly. Please enable it to take advantage of the complete set of features!
Skip to main page content
U.S. flag

An official website of the United States government

Dot gov

The .gov means it’s official.
Federal government websites often end in .gov or .mil. Before sharing sensitive information, make sure you’re on a federal government site.

Https

The site is secure.
The https:// ensures that you are connecting to the official website and that any information you provide is encrypted and transmitted securely.

NIH NLM Logo
Log in
Access keys NCBI Homepage MyNCBI Homepage Main Content Main Navigation
. 2022 Jul 26;119(30):e2016732119.
doi: 10.1073/pnas.2016732119. Epub 2022 Jul 21.

fMRI spectral signatures of sleep

Affiliations

fMRI spectral signatures of sleep

Chen Song et al. Proc Natl Acad Sci U S A. .

Abstract

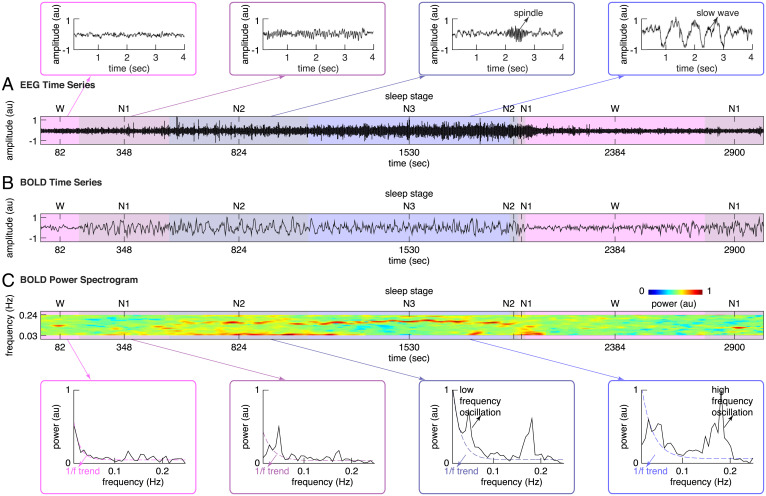
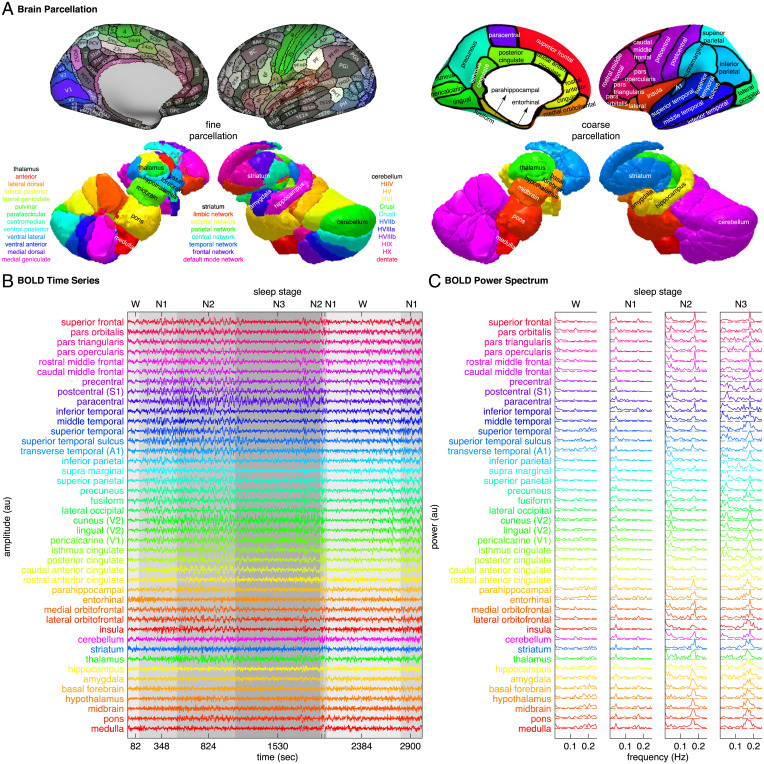
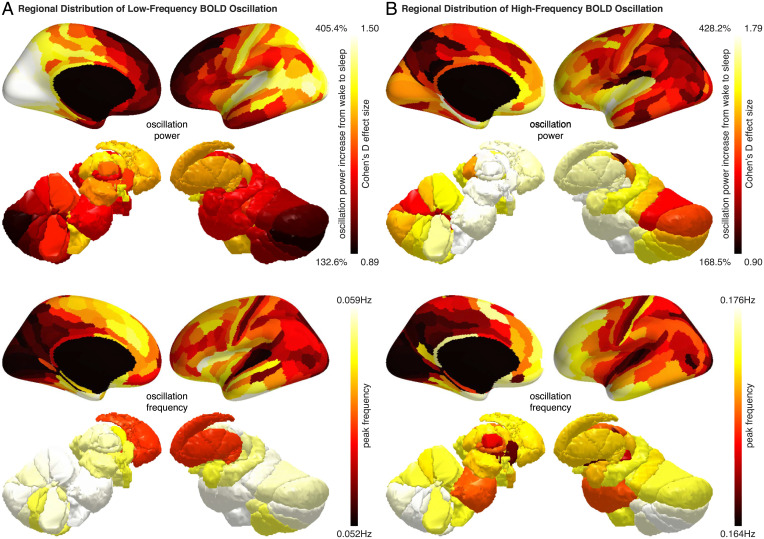
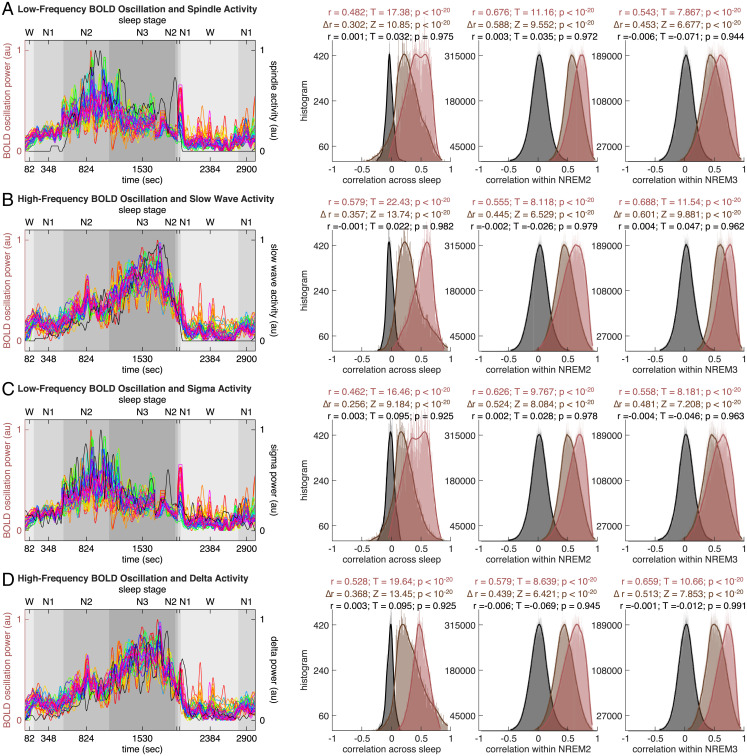
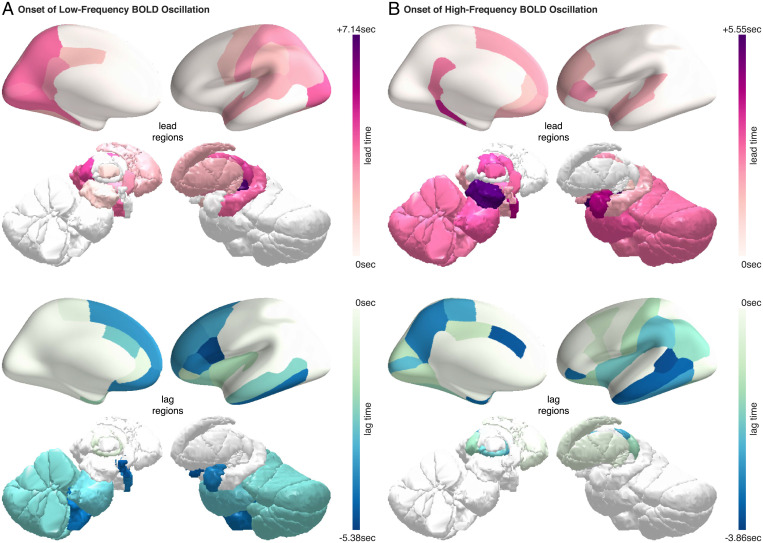
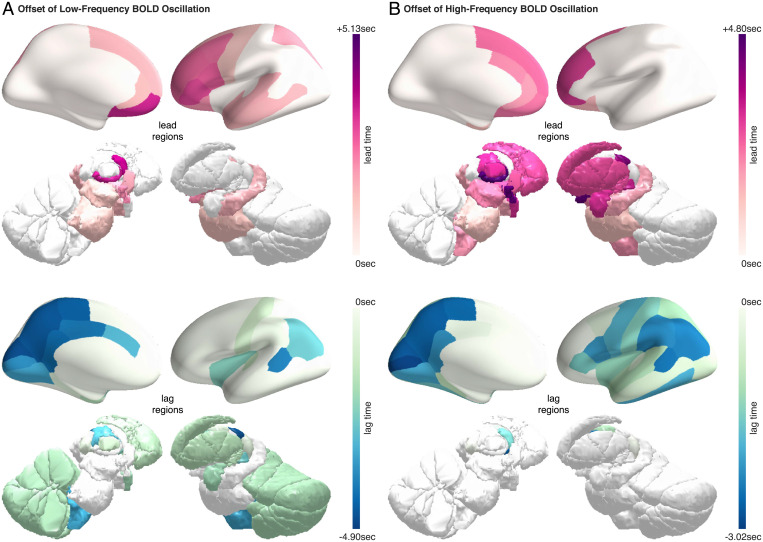
Sleep can be distinguished from wake by changes in brain electrical activity, typically assessed using electroencephalography (EEG). The hallmark of nonrapid-eye-movement (NREM) sleep is the shift from high-frequency, low-amplitude wake EEG to low-frequency, high-amplitude sleep EEG dominated by spindles and slow waves. Here we identified signatures of sleep in brain hemodynamic activity, using simultaneous functional MRI (fMRI) and EEG. We found that, at the transition from wake to sleep, fMRI blood oxygen level-dependent (BOLD) activity evolved from a mixed-frequency pattern to one dominated by two distinct oscillations: a low-frequency (<0.1 Hz) oscillation prominent in light sleep and correlated with the occurrence of spindles, and a high-frequency oscillation (>0.1 Hz) prominent in deep sleep and correlated with the occurrence of slow waves. The two oscillations were both detectable across the brain but exhibited distinct spatiotemporal patterns. During the falling-asleep process, the low-frequency oscillation first appeared in the thalamus, then the posterior cortex, and lastly the frontal cortex, while the high-frequency oscillation first appeared in the midbrain, then the frontal cortex, and lastly the posterior cortex. During the waking-up process, both oscillations disappeared first from the thalamus, then the frontal cortex, and lastly the posterior cortex. The BOLD oscillations provide local signatures of spindle and slow wave activity. They may be employed to monitor the regional occurrence of sleep or wakefulness, track which regions are the first to fall asleep or wake up at the wake-sleep transitions, and investigate local homeostatic sleep processes.

Keywords: BOLD oscillations; fMRI-EEG; sleep; wake–sleep transitions.


Conflict of interest statement

The authors declare no competing interest.

Figures

Fig. 1.
Fig. 1.
BOLD spectral changes from wake to sleep. (A) The EEG time series from simultaneous fMRI-EEG recordings of sleep in a representative participant were plotted, illustrating the shift from high-frequency, low-amplitude wake EEG to low-frequency, high-amplitude sleep EEG dominated by spindles and slow waves. (B and C) The BOLD time series and the BOLD power spectrogram from simultaneous fMRI-EEG recordings of sleep in the same participant were plotted, illustrating the BOLD spectral changes from wake to sleep. During wakefulness, mixed-frequency, low-amplitude BOLD activity was observed; correspondingly, the BOLD power spectrum displayed a scale-free 1/f trend. By contrast, during sleep, BOLD activity evolved into a high-amplitude background with low-frequency oscillation in N1, N2 sleep and high-frequency oscillation in N2, N3 sleep; correspondingly, the BOLD power spectrum displayed a low-frequency and a high-frequency peak on top of the scale-free 1/f trend.
Fig. 2.
Fig. 2.
BOLD spectral analysis. (A) To investigate the regional distributions of BOLD oscillations, we parcellated the cortex into 32 coarse regions or 180 fine regions, and the subcortex into 10 coarse regions (cerebellum, striatum, thalamus, medulla, pons, midbrain, hypothalamus, basal forebrain, amygdala, and hippocampus) or 37 fine regions (11 cerebellum lobules, 7 striatum divisions, 12 thalamic subregions, medulla, pons, midbrain, hypothalamus, basal forebrain, amygdala, and hippocampus). (B and C) We derived the BOLD power spectrogram of each brain region by applying sliding-window FFT analysis to the BOLD time series of individual voxels and computing the average power spectrogram across all voxels within the region. Plotted here are the regional average BOLD time series and the regional average BOLD power spectrum from simultaneous fMRI-EEG recordings of sleep in a representative participant.
Fig. 3.
Fig. 3.
Regional distributions of BOLD oscillations during sleep. Regional increase in BOLD oscillation power from wake to sleep, averaged across two hemispheres and all participants, was projected onto three-dimensional brain models (Upper). The power of low-frequency BOLD oscillation (A) and the power of high-frequency BOLD oscillation (B) both showed a 200 to 300% increase from wake to sleep. However, the low-frequency BOLD oscillation was strong in posterior and sensory regions but weak in frontal and entorhinal regions (A), whereas the high-frequency BOLD oscillation was strong in frontal and entorhinal regions but weak in posterior and sensory regions (B). Regional value of BOLD oscillation frequency, averaged across two hemispheres and all participants, was also projected onto three-dimensional brain models (Lower). The oscillation frequency was higher in frontal and subcortical regions and lower in posterior and sensory regions for both the low-frequency BOLD oscillation (A) and the high-frequency BOLD oscillation (B).
Fig. 4.
Fig. 4.
BOLD oscillations and spindle or slow wave activity. The time course of low-frequency BOLD oscillation power (A and C, colored lines, one color per region, see Fig. 2 for color codes) or high-frequency BOLD oscillation power (B and D, colored lines, one color per region, see Fig. 2 for color codes) or BOLD amplitude was correlated against the time course of spindle activity (A, black line), slow wave activity (B, black line), sigma power (C, black line), or delta power (D, black line), both across sleep stages (examining global, across-stage correlation) and within sleep stages (examining local, within-stage correlation). The correlation was calculated on a region-by-region, participant-by-participant basis. The distribution of correlation coefficient across all brain regions and all participants was plotted, to evaluate the statistical significance of the correlation. The analysis revealed a positive correlation between low-frequency BOLD oscillation and spindle activity (A, red-colored histograms) or sigma activity (C, red-colored histograms), as well as a positive correlation between high-frequency BOLD oscillation and slow wave activity (B, red-colored histograms) or delta activity (D, red-colored histograms). It also revealed a lack of correlation between BOLD amplitude and spindle activity (A, gray-colored histograms), slow wave activity (B, gray-colored histograms), sigma activity (C, gray-colored histograms), or delta activity (D, gray-colored histograms). Moreover, it showed that the low-frequency BOLD oscillation correlated more strongly with spindle activity than with slow wave activity (A, brown-colored histograms), and with sigma activity than with delta activity (C, brown-colored histograms), whereas the high-frequency BOLD oscillation correlated more strongly with slow wave activity than with spindle activity (B, brown-colored histograms), and with delta activity than with sigma activity (D, brown-colored histograms).
Fig. 5.
Fig. 5.
Onset of BOLD oscillations during the falling asleep process. The temporal lag between different brain regions in the onset of BOLD oscillations at the transition from wake to sleep was projected onto three-dimensional brain models. The regions that led other regions in the onset of BOLD oscillations are shown in red-purple colormap (Upper), where the lead time quantifies the degree to which they led. The regions that lagged behind other regions in the onset of BOLD oscillations are shown in blue-green colormap (Lower), where the lag time quantifies the degree to which they lagged. For better illustrations, the lead time and the lag time are marked with plus and the minus signs, respectively. The low-frequency BOLD oscillation and the high-frequency BOLD oscillation had markedly distinct onset patterns. (A) The low-frequency BOLD oscillation first appeared in the sensory thalamus and then in sensory and posterior cortices; the frontal cortices, by comparison, were among the last regions to see the onset of low-frequency BOLD oscillation. (B) The high-frequency BOLD oscillation, on the other hand, first appeared in the midbrain and then in frontal cortices. The sensory and posterior cortices, by comparison, were among the last regions to see the onset of high-frequency BOLD oscillation.
Fig. 6.
Fig. 6.
Offset of BOLD oscillations during the waking up process. The temporal lag between different brain regions in the offset of BOLD oscillations at the transition from sleep to wake was projected onto three-dimensional brain models. The regions that led other regions in the offset of BOLD oscillations are shown in red-purple colormap (Upper), where the lead time quantifies the degree to which they led. The regions that lagged behind other regions in the offset of BOLD oscillations are shown in blue-green colormap (Lower), where the lag time quantifies the degree to which they lagged. For better illustrations, the lead time and the lag time are marked with plus and the minus signs, respectively. The low-frequency BOLD oscillation (A) and the high-frequency BOLD oscillation (B) had similar offset patterns. They both disappeared first from the intralaminar thalamus and then from other thalamic subregions; soon after, they disappeared in the cortex, starting with frontal regions and ending with posterior and sensory regions.
Fig. 7.
Fig. 7.
Physiology spectral analysis. (AC) To examine whether the pre-processed fMRI data were indeed clean of non-neuronal physiological signals, we inspected the frequency content of respiratory or cardiac activity and compared that against the BOLD frequency content. We applied sliding-window FFT analysis to the time series of raw respiratory data, respiratory rate, respiratory volume, respiratory depth, raw cardiac data, and cardiac rate. The power spectrum of raw respiratory data had a principal peak at around 0.25 Hz and the power spectrum of raw cardiac data had a principal peak at around 1 Hz, reflecting, respectively, the oscillations in respiration and cardiac pulse activities. The power spectrums of respiratory rate, respiratory volume, respiratory depth, and cardiac rate can be divided into the low-frequency (0.04∼0.15 Hz) and high-frequency (0.15∼0.4 Hz) bands, reflecting, respectively, the slower and faster oscillations in these physiological signals. (D and E) Based on the power spectrums of raw respiratory data and raw cardiac data, we extracted the respiration and cardiac pulse frequencies, calculated their alias frequencies, and compared these physiological frequencies against the peak frequencies of BOLD oscillations, on an interindividual basis across all participants. We did not observe a significant correlation between BOLD oscillation frequencies and respiratory or cardiac frequencies.
Fig. 8.
Fig. 8.
BOLD oscillations and respiratory or cardiac activity. The time course of low-frequency BOLD oscillation power (A and C, black lines, illustrating whole brain average) or high-frequency BOLD oscillation power (B and D, black lines, illustrating whole brain average) was correlated against the time course of respiratory oscillation power (A and B, colored lines, see Fig. 7 for color codes), including the band-limited power of respiration activity (respiration frequency ± 0.1 Hz), the low-frequency (0.04∼0.15 Hz) and high-frequency (0.15∼0.4 Hz) power of respiratory rate, respiratory volume, respiratory depth, or the time course of cardiac oscillation power (C and D, colored lines, see Fig. 7 for color codes), including the band-limited power of cardiac pulse activity (cardiac pulse frequency ± 0.4 Hz), the low-frequency (0.04∼0.15 Hz) and high-frequency (0.15∼0.4 Hz) power of cardiac rate , both across sleep stages (examining global, across-stage correlation) and within sleep stages (examining local, within-stage correlation). The correlation was calculated on a region-by-region, participant-by-participant basis. The distribution of correlation coefficient across all brain regions and all participants was plotted to evaluate the statistical significance of the correlation. The analysis revealed a lack of correlation between BOLD oscillation power and respiratory or cardiac oscillation power.

References

    1. Steriade M., Timofeev I., Grenier F., Natural waking and sleep states: A view from inside neocortical neurons. J. Neurophysiol. 85, 1969–1985 (2001). - PubMed
    1. Crunelli V., David F., Lőrincz M. L., Hughes S. W., The thalamocortical network as a single slow wave-generating unit. Curr. Opin. Neurobiol. 31, 72–80 (2015). - PubMed
    1. Siclari F., Tononi G., Local aspects of sleep and wakefulness. Curr. Opin. Neurobiol. 44, 222–227 (2017). - PMC - PubMed
    1. Vyazovskiy V. V., et al. , Local sleep in awake rats. Nature 472, 443–447 (2011). - PMC - PubMed
    1. Nobili L., et al. , Dissociated wake-like and sleep-like electro-cortical activity during sleep. Neuroimage 58, 612–619 (2011). - PubMed

Publication types

Cite

AltStyle によって変換されたページ (->オリジナル) /