This site needs JavaScript to work properly. Please enable it to take advantage of the complete set of features!
Skip to main page content
U.S. flag

An official website of the United States government

Dot gov

The .gov means it’s official.
Federal government websites often end in .gov or .mil. Before sharing sensitive information, make sure you’re on a federal government site.

Https

The site is secure.
The https:// ensures that you are connecting to the official website and that any information you provide is encrypted and transmitted securely.

NIH NLM Logo
Log in
Access keys NCBI Homepage MyNCBI Homepage Main Content Main Navigation
. 2022 Aug;25(8):1059-1070.
doi: 10.1038/s41593-022-01102-9. Epub 2022 Jul 7.

Memory-enhancing properties of sleep depend on the oscillatory amplitude of norepinephrine

Affiliations

Memory-enhancing properties of sleep depend on the oscillatory amplitude of norepinephrine

Celia Kjaerby et al. Nat Neurosci. 2022 Aug.

Abstract

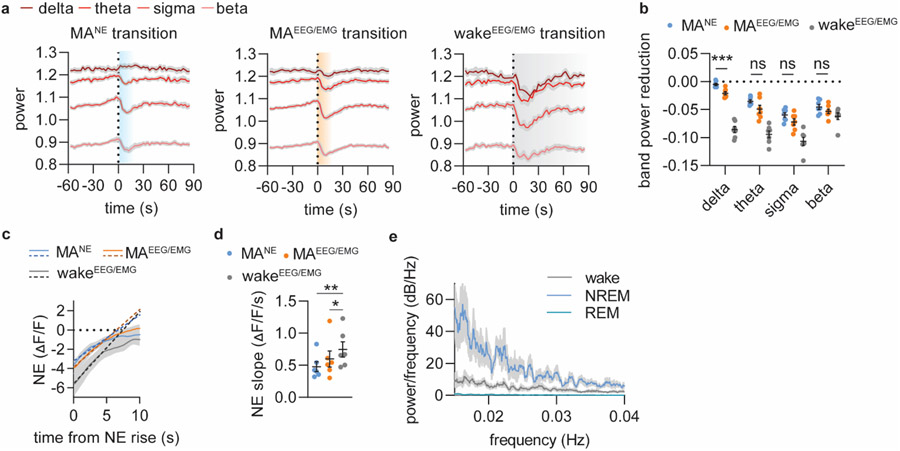
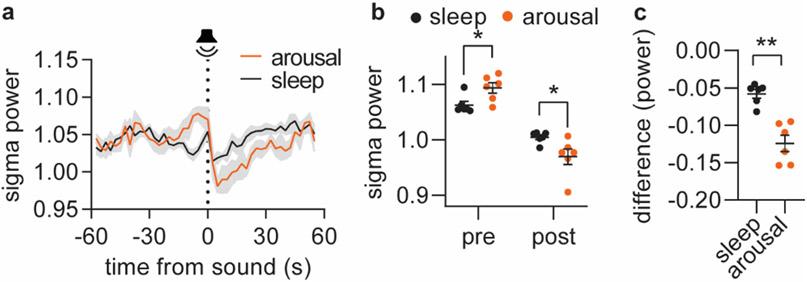
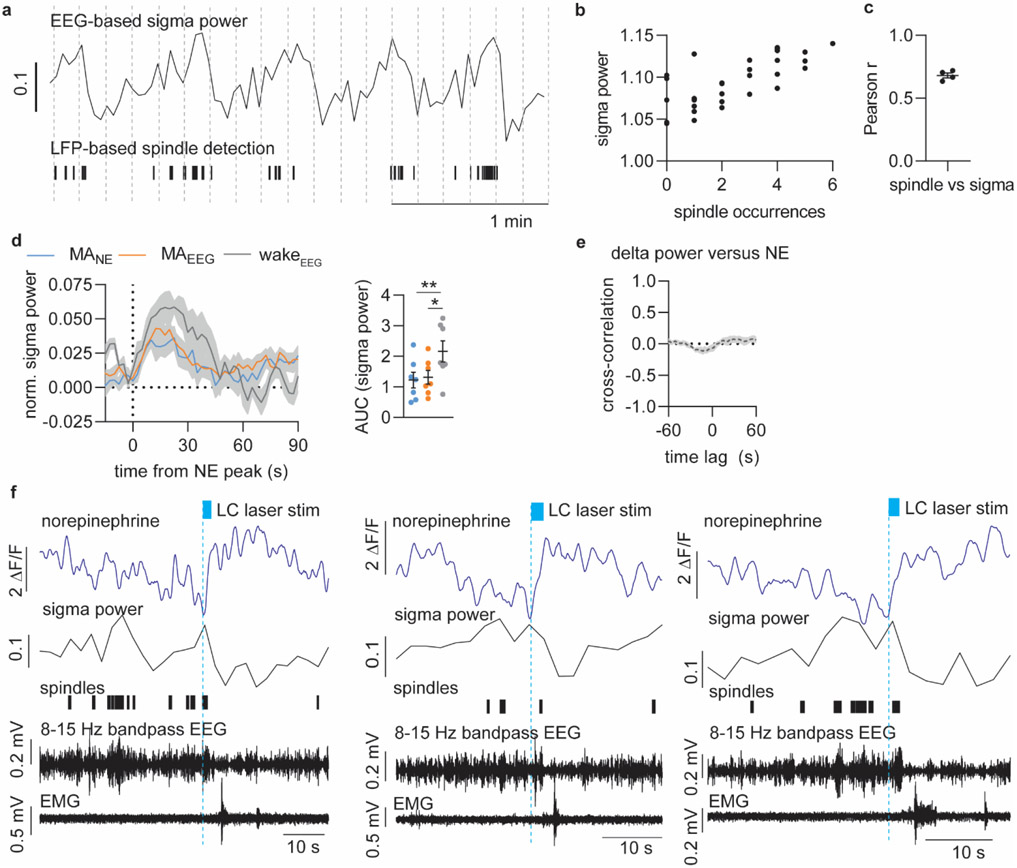
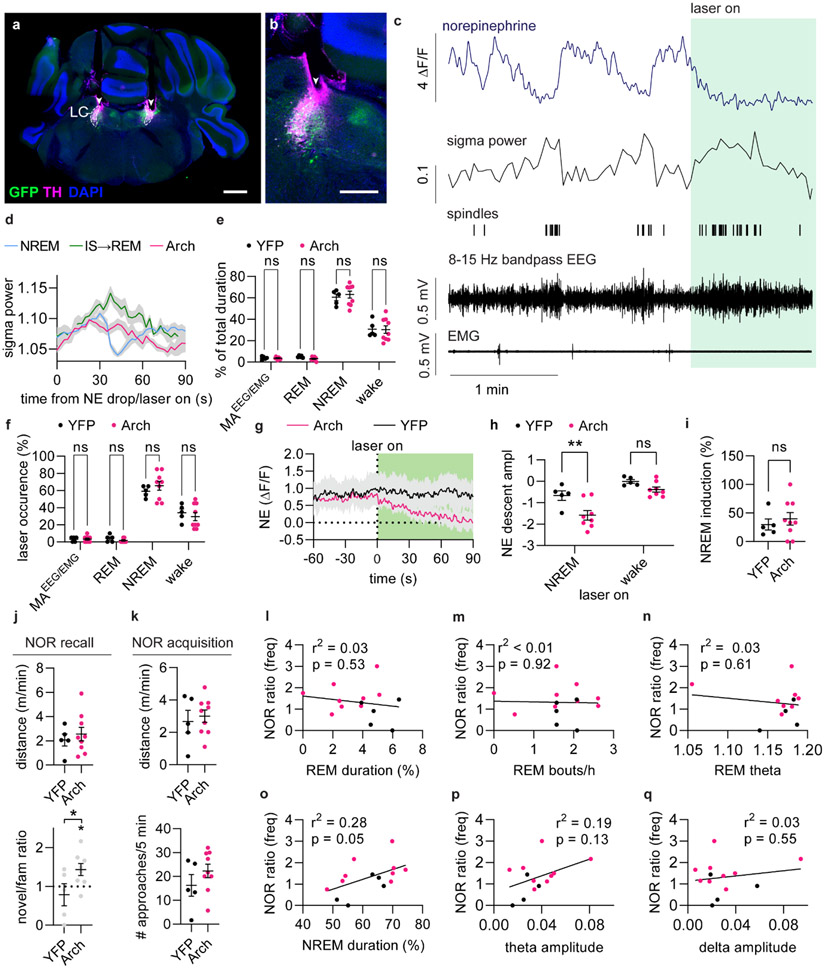
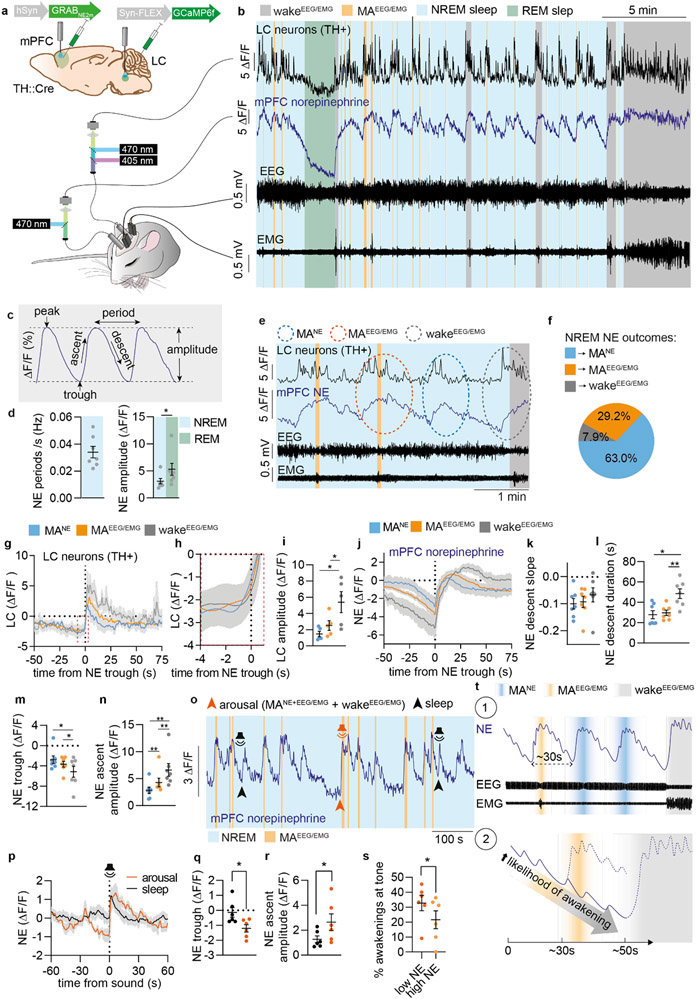
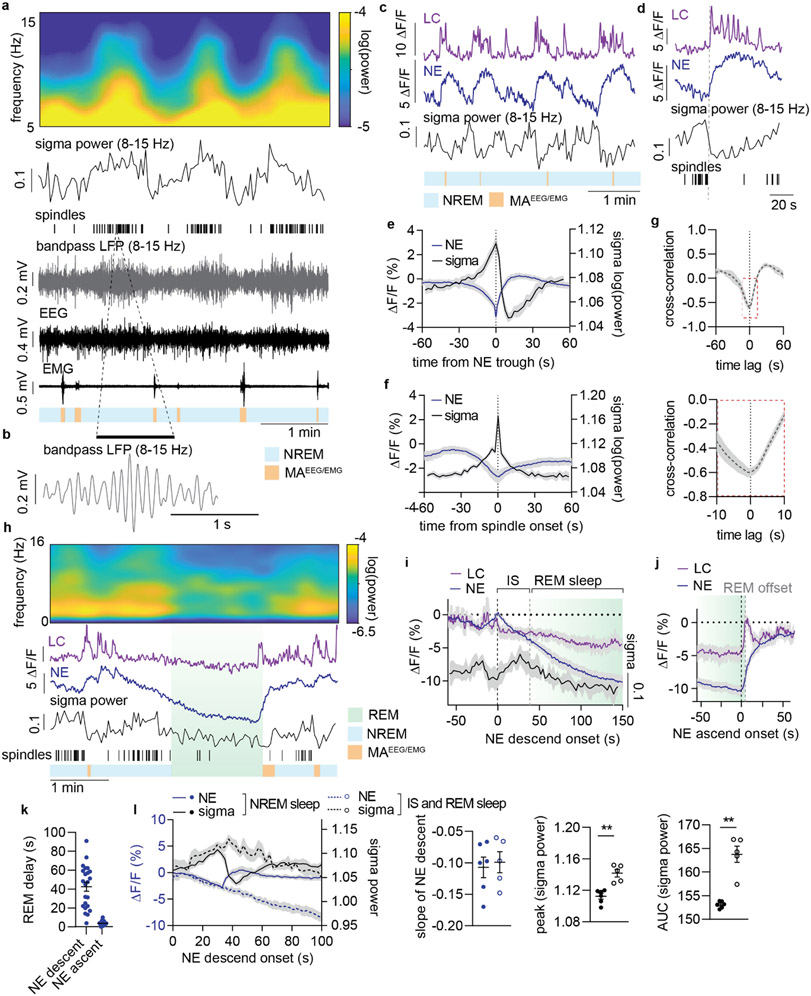
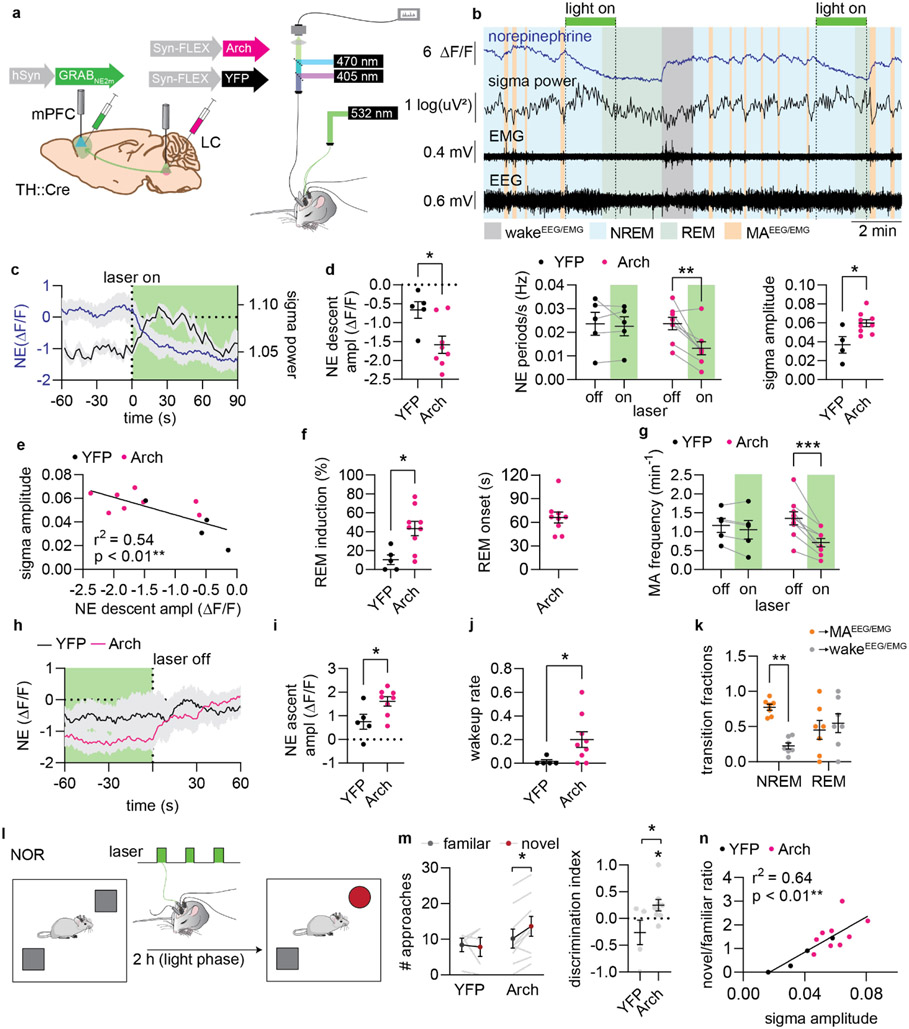
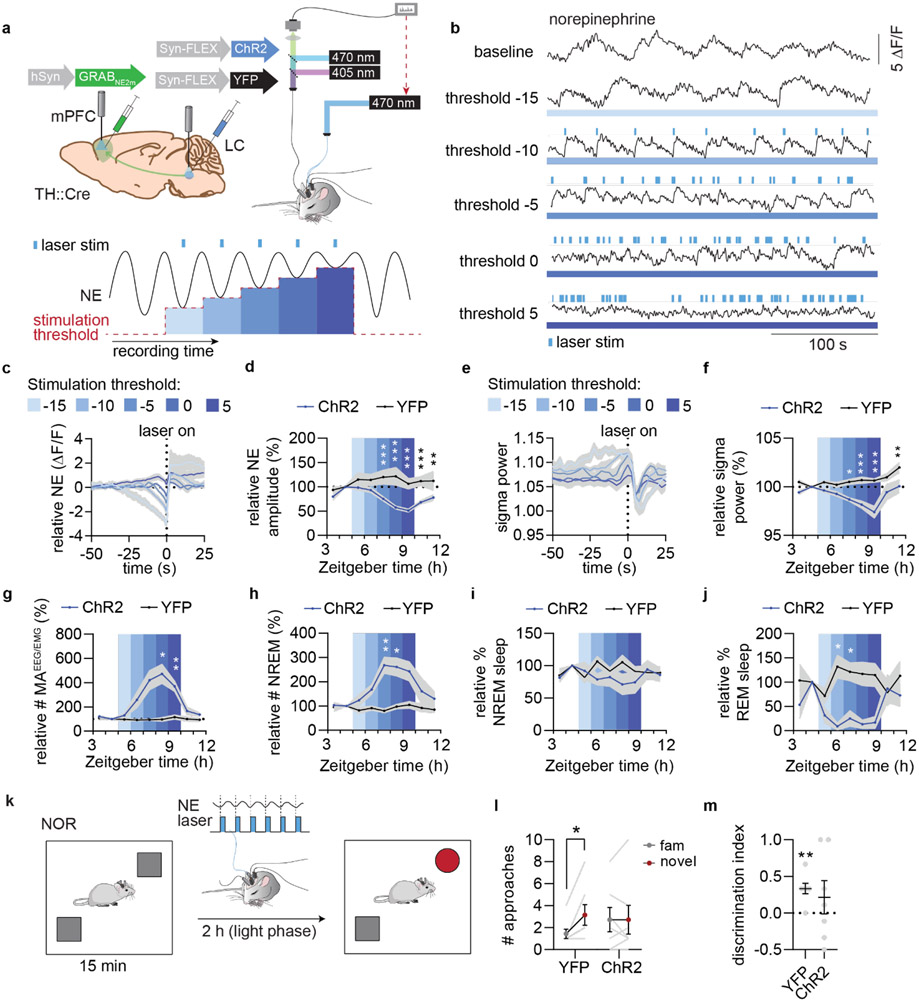
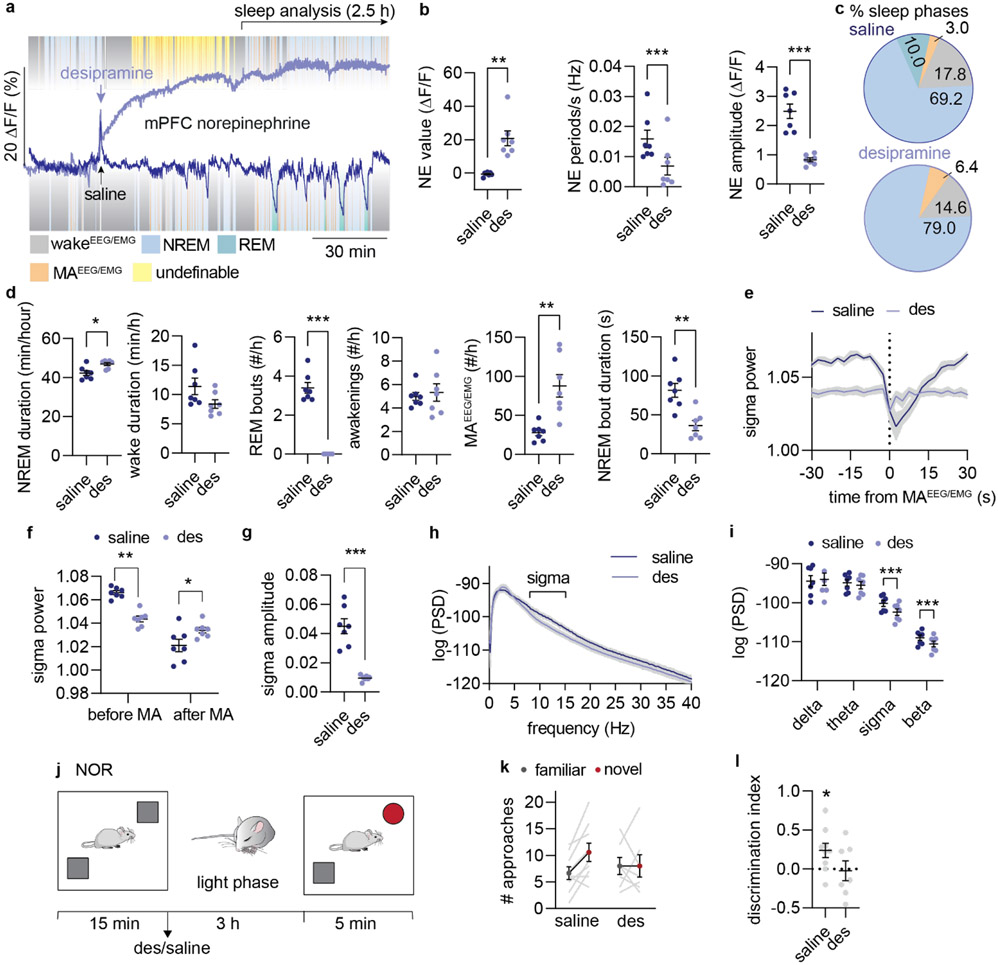
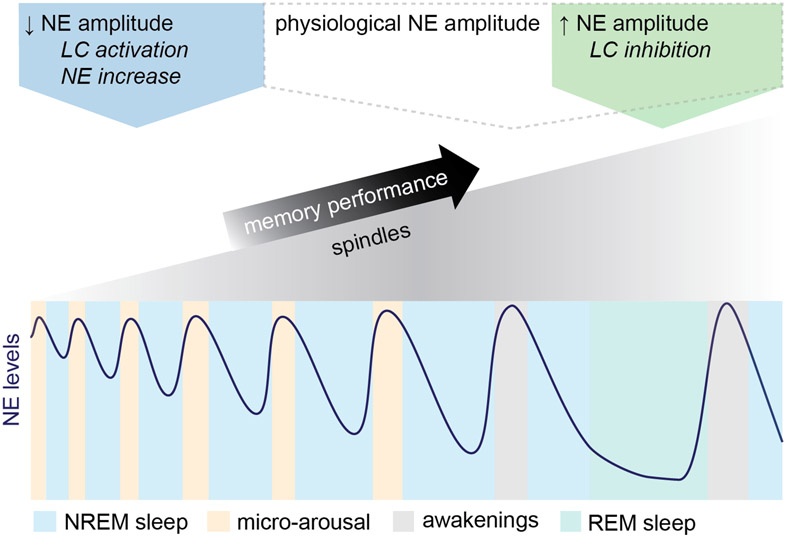
Sleep has a complex micro-architecture, encompassing micro-arousals, sleep spindles and transitions between sleep stages. Fragmented sleep impairs memory consolidation, whereas spindle-rich and delta-rich non-rapid eye movement (NREM) sleep and rapid eye movement (REM) sleep promote it. However, the relationship between micro-arousals and memory-promoting aspects of sleep remains unclear. In this study, we used fiber photometry in mice to examine how release of the arousal mediator norepinephrine (NE) shapes sleep micro-architecture. Here we show that micro-arousals are generated in a periodic pattern during NREM sleep, riding on the peak of locus-coeruleus-generated infraslow oscillations of extracellular NE, whereas descending phases of NE oscillations drive spindles. The amplitude of NE oscillations is crucial for shaping sleep micro-architecture related to memory performance: prolonged descent of NE promotes spindle-enriched intermediate state and REM sleep but also associates with awakenings, whereas shorter NE descents uphold NREM sleep and micro-arousals. Thus, the NE oscillatory amplitude may be a target for improving sleep in sleep disorders.


Figures

Extended Figure 1.
Extended Figure 1.. All ascending stages of NE oscillations are associated with EEG-defined micro-arousals or awakenings.
a. Mean power traces for delta, theta, sigma and beta frequency bands aligned to NE rise associated with EEG/EMG-based transitions from NREM sleep to continued NREM sleep (blue, MANE), micro-arousals (MAEEG/EMG, orange) and wake (grey, wakeEEG/EMG). b. Summary plot showing the reduction in band power across the different transitions. There was no difference between MANE and MAEEG/EMG for theta, sigma and beta band power, which are the frequencies used to assess micro-arousals. Significance was calculated by means of two-way repeated measures ANOVA with Šídák’s post hoc test (only MANE and MAEEG/EMG post hoc comparisons shown in graph for simplicity, P = 0.0003, delta; P = 0.13, theta; P = 0.11, sigma; P = 0.65, beta). c. Slope of linear regression on 5 initial seconds of NE rise was used as estimate for rise time. d. NE slope across the different type of transitions (repeated measures one-way ANOVA with Tukey's multiple comparisons test, P = 0.0059, MANE vs wake; P = 0.041, MAEEG/EMG vs wake). e. Multi-taper power spectral analysis showed increased power for slower frequencies for NREM sleep compared to wake and REM sleep with no defined peak frequency likely due to the discrete nature of NE oscillations. n = 7. Data is shown as mean±SEM. ***p < 0.001.
Extended Figure 2.
Extended Figure 2.. Decrease in sigma power marks tone-evoked arousal.
Based on the local decline in sigma power in response to tone (> 0.1 log(μV2)), the tone outcome was divided into arousal and otherwise maintained sleep. a. Mean sigma power traces in response to tone leading to either arousal or persistent sleep. b. The maximum value of sigma power maximum prior to tone (‘pre’) and the minimum sigma power after the tone (‘post’) for the defined arousal and sleep conditions. c. The difference in sigma power occurring in response to the tone. Significance was calculated by means of two-way repeated measures ANOVA with Šídák’s post hoc test (b, P = 0.035, pre; P = 0.023, post) or two-tailed paired t-test (c, P = 0.0034). n = 6. Data is shown as mean±SEM. *p < 0.05, **p < 0.01.
Extended Figure 3.
Extended Figure 3.. Supplementary Figure S6. Relationship between norepinephrine, sigma power, spindles and delta power.
a. Representative trace showing sigma power of surface EEG recordings with corresponding detection of spindles based on S1 cortical LFP recordings. b. Correlation between spindle occurrences and mean sigma power across 10 s bins over a 5 min NREM sleep episode. c. Mean Pearson r values (0.63 +/− 0.02). d. Mean sigma power traces normalized to baseline showing the amount of sigma power increase associated with NE descents preceeding microarousals (MANE or MAEEG/EMG) or awakenings (wakeEEG/EMG). Calculated area under the curve (AUC) for sigma power is largest during the NE descents associated with awakenings transitions (two-tailed paired t-test; P = 0.60, MANE vs MAEEG/EMG; P = 0.0057, MANE vs wake; P = 0.044, MAEEG/EMG vs wake).e. Mean correlation coefficient between delta power and NE level (5 min NREM sleep episodes) f. Three different example traces showing how optogenetic activation of locus coeruleus (LC, 2 s 20 Hz 10 ms pulses) during periods of NE descend leads to NE ascend followed by a delayed change in spindle occurrences and amplitude reduction of 7-15 bandpass filtered EEG that is not represented by sigma power (window = 5 s, overlap: 2.5 s). n = 4 (c); n = 7 (d-e). Data is shown as mean±SEM. *p < 0.05, **p < 0.01.
Extended Figure 4.
Extended Figure 4.. Optogenetic suppression of LC.
a. Arch expression in LC was verified by co-staining for TH and GFP. Arrowheads indicate the tip location of the optic fiber (scale bar = 800 μm). b. Close up of a (scale bar = 400 μm). c. Example traces showing norepinephrine level, sigma power, sleep spindles, bandpass LFP in sigma range, and EMG raw data. d. Mean sigma power aligned to onset of NE drop (NREM and IS-REM) or onset of laser stimulation (Arch). e. Time spent in sleep/wake stages during 2 h recording between memory encoding and recall (2-way repeated measures ANOVA with Šídák’s multiple comparison post hoc test). f. Number of laser stimulation (% of total number) in each sleep/wake stage (2-way repeated measures ANOVA with Šídák’s multiple comparison post hoc test). g. Mean NE trace at laser onset during wakefulness. h. NE descent amplitude induced by laser onset during NREM and wakefulness (2-way repeated measures ANOVA with Šídák’s multiple comparison post hoc test, P = 0.0046, NRREM). i. Percentage of laser stimulations during wakefulness resulting in transition to NREM sleep (unpaired t-test). j. Distance moved and ratio between approaches during the recall phase of the novel object recognition (NOR) (two-tailed unpaired t-test, P = 0.049, one-sample t-test P = 0.49, YFP; P = 0.026, Arch). k. Distance moved and object approaches during the acquisition phase of the NOR (unpaired t-test). l. Linear regression between object exploration ratio and time spent in REM sleep. m. Linear regression between object exploration ratio and number of REM bouts/h. n. Linear regression between object exploration ratio and mean theta power during REM sleep. o. Linear regression between object exploration ratio and time spent in NREM sleep. p. Linear regression between object exploration ratio and theta amplitude in response to laser. q. Linear regression between object exploration ratio and delta amplitude in response to laser. n = 9 Arch, 5 YFP. Data is shown as mean±SEM. *p < 0.05, **p < 0.01.
Extended Figure 5.
Extended Figure 5.. Optogenetic activation of LC.
a. Distance moved and ratio between novel and familiar object approaches during recall phase of novel object recognition (two-tailed unpaired t test, P = 0.052, one-sample t test, P = 0.35, YFP; P = 0.64, ChR2). b. Distance moved and object exploration during memory acquisition (right) (unpaired t test). n = 7 ChR2, 7 YFP. Data is shown as mean±SEM. *p < 0.05.
Extended Figure 6.
Extended Figure 6.. The effect of NE reuptake inhibition on EEG and arousability.
a. Representative traces of norepinephrine, raw EEG and EMG before and after administration of the NE reuptake inhibitor, desipramine (des, 10 mg/kg). b. Example EEG and EMG traces from NREM sleep prior to desipramine administration (top), during undefinable phases following desipramine administration (middle) and from defined NREM sleep following administration with desipramine (bottom). c. Sigma power traces aligned to the onset of awakenings (wakeEEG/EMG) following either treatment with saline or desipramine. d. Mean sigma power before and after NREM-wakeEEG/EMG transition (2-way repeated measures ANOVA with Šídák’s multiple comparison post hoc test, P = 0.0024, pre; P = 0.031, post). e. Reduction in sigma power amplitude (two-tailed paired t-test, P = 0.0007). f. Distance moved and ratio between novel and familiar object approaches during the recall phase of the novel object recognition (NOR) as well as distance moved and number of object approaches during the acquisition phase (unpaired t-test and one-sample t-test). n = 7 (c-e), n = 7 des, 9 sal (f). Data is shown as mean±SEM. **p < 0.01, ***p < 0.001.
Figure 1.
Figure 1.. Increased NE descent amplitude primes awakenings over micro-arousals.
a. GRABNE2m and GCAMP6f were expressed in medial prefrontal cortex (mPFC) and locus coeruleus (LC), respectively, for combined norepinephrine (NE) and LC Ca2+ measurements alongside EEG and EMG recordings. b. Representative traces of simultaneous recordings with EEG- scored sleep stages. c. Terminology used to describe NE oscillations. d. Mean NE oscillation frequency and amplitude during NREM and REM sleep (two-tailed paired t-test, P = 0.020). e. Representative traces showing NREM-related NE events associated with micro-arousals accompanied only by EEG and not EMG changes (MANE), EEG/EMG-defined micro-arousals (MAEEG/EMG), or waking. f. Percentage of state transition outcome from each NE period. g. Mean LC traces aligned to onset of NE ascent. h. Zoom-in of mean LC traces (red dotted square in g). i. Amplitude of LC responses across all state transitions (two-tailed paired t-test; P = 0.09, MANE vs MAEEG/EMG; P = 0.02, MANE vs wake; P = 0.04, MAEEG/EMG vs wake). j. Mean NE traces aligned to onset of NE rise at behavioral transitions. k-n. Mean slope of NE descent (two-tailed paired t-test; P = 0.55, NREM vs MAEEG/EMG; P = 0.20, NREM vs wake; P = 0.19, MAEEG/EMG vs wake), NE descent time (two-tailed paired t-test; P = 0.58, MANE vs MAEEG/EMG; P = 0.015, MANE vs wake; P = 0.0051, MAEEG/EMG vs wake), NE trough level (two-tailed paired t-test; P = 0.22, MANE vs MAEEG/EMG; P = 0.032, MANE vs wake; P = 0.049, MAEEG/EMG vs wake), and NE ascent amplitude prior to transitions (two-tailed paired t-test; P = 0.0068, MANE vs MAEEG/EMG; P = 0.0021, MANE vs wake; P = 0.0022, MAEEG/EMG vs wake). o. Another batch of animals was exposed to tones during sleep/wake behavior while GRABNE2m fluorescence was measured as shown in representative trace. Tones during NREM sleep were divided into outcome (sleep or arousal). p. Mean NE traces related to tone onset. q-r. NE trough level (two-tailed, paired t-test; P = 0.048) and ascent amplitude (two-tailed paired t-test; P = 0.025) at tone-induced sleep versus arousal. s. NE trough levels prior to each tone was classified as low or high (above or below mean NE trough value prior to all tones), and wakeup rate is shown for each group (two-tailed paired t-test; P = 0.043). t. Schematic summarizing our two main findings on the role of NE in sleep microarchitecture: 1) Regular NE oscillations dictate micro-arousals; 2) Longer periods of NE descent associate with increased probability of awakening. d-n: n = 7; o-s: n = 6. Data is shown as mean±SEM. *P< 0.05, **P< 0.01, ***P< 0.001.
Figure 2.
Figure 2.. Prolonged NE descent promotes spindle-rich IS and REM sleep transitions.
a. Representative simultaneous surface EEG and depth local field potential (LFP) recordings showing the correlation between LFP-based spindle detection and EEG-based sigma power. Displayed are EEG power spectrogram, EEG-based sigma power, LFP-based spindle occurrences, 8-15 Hz bandpass filtered LFP, raw EEG and EMG, and color-coded sleep phases. b. Zoom-in of 8-15 Hz bandpass filtered LFP showing a representative spindle. c. Representative traces from simultaneous measurements of locus coeruleus (LC) and norepinephrine (NE) during NREM sleep and their association with sigma power. d. Representative LC and NE traces as well as sigma power and spindle occurrences upon NE ascent. e. Mean NE and sigma power traces aligned to NE trough during NREM sleep. f. Mean NE and sigma power traces aligned to spindle onset during NREM sleep. g. Cross-correlation between sigma power and NE level based on 10 min NREM sleep epochs. Bottom: zoom-in to illustrate time lag. h. Representative recordings covering REM sleep transitions (REM sleep>150 s in duration) showing EEG power spectrogram, LC and NE traces, sigma power, spindle occurrences and color-coded sleep phases. i. Mean LC and NE activity, and sigma power from NE descent onset preceding REM onset. Mean onset of REM sleep is displayed . The period from NE descent onset until REM sleep onset is marked as intermediate state (IS) sleep. j. Mean LC and NE activity during REM sleep aligned to the onset of NE ascent preceding REM sleep offset. Mean REM sleep offset is marked. k. Mean delay from NE descent onset to REM sleep onset and from NE ascent to REM sleep offset (23 REM sleep occurrences across n = 5). l. Mean NE and sigma power during NREM sleep versus IS-REM sleep from the onset of NE descent; slope of NE descent for NREM and IS sleep (two-tailed, paired t-test; P = 0.89); increase in sigma power peak (two-tailed, paired t-test; P = 0.006) and area under the curve (AUC) (two-tailed, paired t-test; P = 0.005) NREM and IS-REM sleep. Significance was calculated by means of paired t-test. n = 6 (NREM); n = 5 (IS-REM). Data is shown as mean±SEM. **P< 0.01.
Figure 3.
Figure 3.. Optogenetic suppression of LC induces IS-REM sleep sequences and improves memory.
a. Arch, was expressed in LC, while GRABNE2m was expressed in mPFC. Green laser light was delivered to LC during combined fiber photometry and EEG/EMG recordings. b. Example traces showing the effects of 2 min optogenetic suppression of LC on norepinephrine levels and sigma power. c. Mean NE and sigma power traces aligned to laser stimulation onset in Arch-expressing animals. d. NE descent amplitude induced by laser onset during NREM sleep (left) (two-tailed unpaired t-test, P = 0.020), NE oscillation frequency for laser off- and on-periods (middle) (2-way repeated measures ANOVA with Šídák’s multiple comparison post hoc test, P = 0.92 YFP; P = 0.0016, Arch), and mean amplitude of sigma response after laser onset (right) (two-tailed unpaired t-test, P = 0.015). e. Correlation between sigma amplitude and NE change in response to laser stimulation (linear regression). f. Percentage of 2 min laser stimulations resulting in REM transition (left) (two-tailed unpaired t-test, P = 0.011). Mean time from laser onset before REM onset (right). g. Frequency of EEG/EMG-defined micro-arousals (MA) during optogenetic LC suppression (2-way repeated measures ANOVA with Šídák’s multiple comparison post hoc test, P = 0.60, YFP; P < 0.0001, Arch). h. Mean NE traces aligned to laser stimulation offset. i. NE ascend amplitude after laser offset (two-tailed unpaired t-test, P = 0.033). j. The wakeup rate within 15 s of laser offset (one-tailed Mann-Whitney test, P = 0.018). k. Outcome of sleep termination from NREM and REM sleep (animals from Fig. 1-2, 2-way repeated measures ANOVA with Šídák’s multiple comparison post hoc test, P = 0.0013, NREM, P = 0.75, REM). l. Animals were subjected to novel object recognition and allowed to sleep for two hours with laser stimulations between encoding and recall. m. Number of approaches to novel and familiar objects (2-way repeated measures ANOVA with Šídák’s multiple comparison post hoc test, P = 0.91 YFP; P = 0.023, Arch) and discrimination index (one-sample t-test, P = 0.32 YFP; P = 0.047, Arch, two-tailed unpaired t-test, P = 0.038). n. Correlation between approach ratio and mean sigma response to laser stimulations during sleep (linear regression). n = 9 Arch, 5 YFP. Data is shown as mean±SEM. *P< 0.05, **P< 0.01, ***P< 0.001.
Figure 4.
Figure 4.. Optogenetic reduction of NE amplitude reduces sigma activity and disrupts memory.
a. Top: ChR2, was expressed in LC, while GRABNE2m was expressed in mPFC. Blue laser light was delivered to LC during combined fiber photometry and EEG/EMG recordings. Bottom: 2 h baseline recording was followed by 5 periods lasting 1 h with increasing NE thresholds for laser stimulations, followed by a 2 h stimulation-free period. Llaser stimulations were triggered when real-time ΔF/F (%) calculations of NE levels went below the threshold. . b. Example traces from each stimulation period is shown with triggered laser stimulations. c. Normalized mean NE traces leading up to laser onset for each stimulation threshold. d. Mean relative NE amplitude during NREM sleep across each stimulation paradigm (2-way repeated measures ANOVA with Šídák’s multiple comparison post hoc test, P = 0.0006, threshold −5; P < 0.0001, threshold 0; P < 0.0001, threshold 5; P = 0.0008, washout 1; P = 0.0079, washout 2). e. Mean sigma power leading up to laser stimulation for each threshold. f. Mean relative sigma power during NREM sleep across stimulation paradigms (2-way repeated measures ANOVA with Šídák’s multiple comparison post hoc test, P = 0.012, threshold −5; P = 0.0001, threshold 0; P < 0.0001, threshold 5; P = 0.0055, washout 2). g-h. Number of micro-arousals (MAEEG/EMG) per minute spent in NREM sleep (2-way repeated measures ANOVA with Šídák’s multiple comparison post hoc test, P = 0.028, threshold 0; P = 0.0064, threshold 5) and NREM sleep bouts per hour (2-way repeated measures ANOVA with Šídák’s multiple comparison post hoc test, P = 0.0090, threshold −5; P = 0.037, threshold 0) during each stimulation paradigm. i-j. Percent time spent in NREM (2-way repeated measures ANOVA with Šídák’s multiple comparison post hoc test) and REM sleep (2-way repeated measures ANOVA with Šídák’s multiple comparison post hoc test, P = 0.024, threshold −10; P = 0.025, threshold −5) across stimulation paradigms. k. Animals were subjected to novel object recognition and stimulated using the threshold=0 paradigm for 2 h between memory encoding and recall. l. Number of approaches to familiar and novel objects (2-way repeated measures ANOVA with Šídák’s multiple comparison post hoc test, P = 0.022 YFP; P > 0.99, ChR2). m. Discrimination index based on number of approaches (one sample t-test, P = 0.0038, YFP; P = 0.38, ChR2; two-tailed unpaired t-test, P = 0.63). n = 7 ChR2, 7 YFP. Data is shown as mean±SEM. *P< 0.05, **P< 0.01, ***P< 0.001.
Figure 5.
Figure 5.. Pharmacological reduction of NE amplitude promotes micro-arousal and compromises memory.
a. Mice were administered with saline or desipramine (des, 10 mg/kg, i.p.) during the light phase and allowed to sleep for 3.5 hrs. 3 days after, treatment was reversed. Analysis was done on 1-3.5 h period after administration. b. Effect of desipramine on mean NE value (two-tailed paired t-test, P = 0.0026), NE oscillation frequency (two-tailed paired t-test, P = 0.0004), and NE amplitude during NREM sleep (two-tailed paired t-test, P = 0.0003). c. Mean distribution of % time spent in NREM sleep, REM sleep, wakefulness and micro-arousals. d. Time spent in NREM sleep (two-tailed paired t-test, P = 0.030) and wake (two-tailed paired t-test, P = 0.64), number of REM bouts (two-tailed paired t-test, P < 0.0001), wake bouts (two-tailed paired t-test, P = 0.70), micro-arousals (two-tailed paired t-test, P = 0.0041), and mean duration of NREM sleep bouts (two tailed paired t-test, P = 0.0029). e. Mean sigma power traces aligned to NREM-to-MAEEG/EMG transition. F. Mean sigma power before and after NREM-to-MAEEG/EMG transition (2-way repeated measures ANOVA with Šídák’s multiple comparison post hoc test, P = 0.0024, before; P = 0.031, after). g. Mean sigma power amplitude reduction across NREM-to-MAEEG/EMG transition (two-tailed paired t-test, P = 0.0007). h-i. Power spectral densities during NREM sleep and mean power spectral densities across frequency bands (2-way repeated measures ANOVA with Šídák’s multiple comparison post hoc test, P = 0.72, delta; P = 0.10, alpha; P = 0.0003, sigma; P < 0.0001, beta). j. In a separate experiment, mice were subjected to novel object recognition (NOR) during their light phase and administered with desipramine or saline immediately after the encoding phase. Mice were allowed to sleep for three hours before the recall phase. k. Number of approaches towards novel versus familiar object during recall . l. Discrimination index for novel versus familiar object (one-sample t-test, P = 0.032, saline; P = 0.86, des; two-tailed unpaired t-test, P = 0.11). n = 7 (a-i), n = 7 des, 9 saline (j-l). Data is shown as mean±SEM. *P< 0.05, **P< 0.01, ***P< 0.001.
Figure 6.
Figure 6.. Model diagram: NE amplitude defines the memory restorative properties of sleep.
This diagram depicts NE amplitude changes during normal sleep micro-architecture and LC-NE manipulations: Sleep is characterized by infraslow ~0.02 Hz NE oscillations and the oscillatory amplitude determines both behavioral arousal and the amount of sleep spindles and spindle-rich IS-REM sleep sequences. Reducing NE oscillation amplitude by NE reuptake inhibition or optogenetic activation increases micro-arousals at the cost of spindle-rich sleep needed for memory consolidation. In contrast, augmenting NE amplitude by optogenetic inhibition favors a sleep composition with more frequent spindle-rich ISand REM sleep transitions resulting in improved memory performance despite increased incidents of awakenings.

Comment in

References

    1. Andrillon T et al. Sleep spindles in humans: insights from intracranial EEG and unit recordings. J Neurosci 31, 17821–34 (2011). - PMC - PubMed
    1. Fernandez LMJ & Lüthi A Sleep Spindles: Mechanisms and Functions. 10.1152/physrev.00042.2018 (2020) doi:10.1152/PHYSREV.00042.2018. - DOI - DOI - PubMed
    1. Bonnet MH & Arand DL EEG arousal norms by age. J Clin Sleep Med 3, 271–4 (2007). - PMC - PubMed
    1. Boselli M, Parrino L, Smerieri A & Terzano MG Effect of age on EEG arousals in normal sleep. Sleep 21, 351–7 (1998). - PubMed
    1. Bonnet MH Effect of Sleep Disruption on Sleep, Performance, and Mood. Sleep 8, 11–19 (1985). - PubMed

Publication types

LinkOut - more resources

Cite

AltStyle によって変換されたページ (->オリジナル) /