This site needs JavaScript to work properly. Please enable it to take advantage of the complete set of features!
Skip to main page content
U.S. flag

An official website of the United States government

Dot gov

The .gov means it’s official.
Federal government websites often end in .gov or .mil. Before sharing sensitive information, make sure you’re on a federal government site.

Https

The site is secure.
The https:// ensures that you are connecting to the official website and that any information you provide is encrypted and transmitted securely.

NIH NLM Logo
Log in
Access keys NCBI Homepage MyNCBI Homepage Main Content Main Navigation
. 2021 Feb 26;12(1):1302.
doi: 10.1038/s41467-021-21478-9.

Combinatorial CRISPR screen identifies fitness effects of gene paralogues

Affiliations

Combinatorial CRISPR screen identifies fitness effects of gene paralogues

Nicola A Thompson et al. Nat Commun. .

Abstract

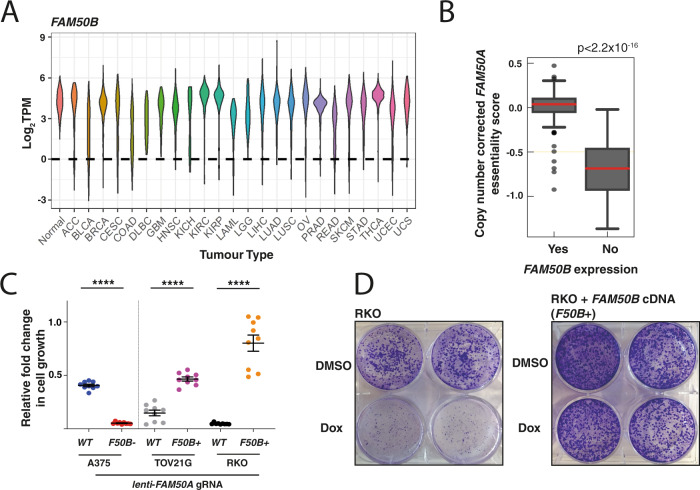
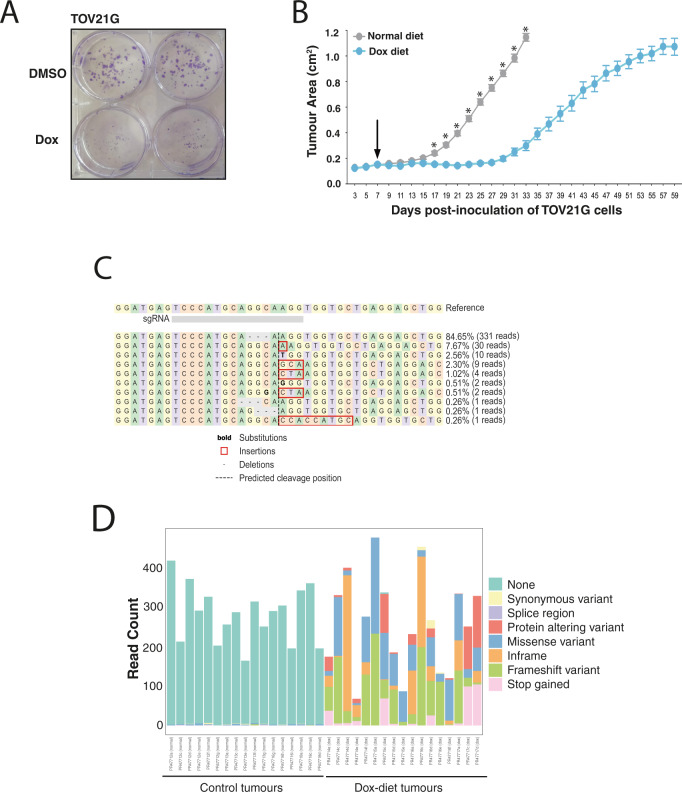
Genetic redundancy has evolved as a way for human cells to survive the loss of genes that are single copy and essential in other organisms, but also allows tumours to survive despite having highly rearranged genomes. In this study we CRISPR screen 1191 gene pairs, including paralogues and known and predicted synthetic lethal interactions to identify 105 gene combinations whose co-disruption results in a loss of cellular fitness. 27 pairs influence fitness across multiple cell lines including the paralogues FAM50A/FAM50B, two genes of unknown function. Silencing of FAM50B occurs across a range of tumour types and in this context disruption of FAM50A reduces cellular fitness whilst promoting micronucleus formation and extensive perturbation of transcriptional programmes. Our studies reveal the fitness effects of FAM50A/FAM50B in cancer cells.


Conflict of interest statement

The authors declare no competing interests.

Figures

Fig. 1
Fig. 1. Combinatorial CRISPR screen for cancer targets.
A Schematic of the genes and gene pairs included in the paired gRNA library. The number of gene pairs for which the minimum guide number could be identified with our gRNA selection criteria is shown. The number in brackets is the total number of pairs in each category. B Design of the multiplex gRNA construct. To assess single-guide activity, a non-targeting gRNA (Fluc) was placed under the hU6 promoter and the gRNA against the candidate gene was placed under the sU6 promoter. To assess paired gene activity, all five gRNAs for one gene were under the hU6 promoter, whereas the guides targeting the other gene were under the sU6 promoter. C Derivation of residual values. The predicted log2-fold change (FC) of the paired construct was calculated from the sum of the growth phenotypes of individual guides and the observed (experimentally determined) log2FC was the actual behaviour of the pair in the screen. The behaviour of the population was modelled using Loess smoothing (blue line). The residual was calculated as the vertical difference of any given point to the blue line. The more negative the residual, the more lethal the pair in the screen. The behaviour of the gRNA pairs for the nine synthetic lethal interactions common to all cell lines is shown in the A375 cell line. D Overlap between the synthetic lethal pairs identified in the screen in each of the three cell lines at Day 28. Significant gene pairs were defined as having a significantly more lethal pairwise effect on cellular fitness than expected from the effect of each individual gene (see Methods). Pairs where one of the genes was found to be lethal in isolation at Day 14 were excluded. E Percentage DNA sequence similarity between paralogues in our screen, identified as synthetic lethal in ≥1 cell line (Ever SL) vs zero cell lines (Never SL). Error bars show mean and standard deviation (SD) with each data point representing the average sequence similarity between paralogue pairs (see Source Data). The p value was determined using the two-tailed Mann–Whitney test.
Fig. 2
Fig. 2. Validation of candidate synthetic lethal pairs.
A Schematic of the competitive growth assay. Cas9-expressing cells were infected with lentiviruses expressing each gRNA in a BFP or mCherry vector to create four populations and read by FACS at day 4 and 14. B Example of a synthetic lethal pair. A375-Cas9 cells were transduced with lentiviruses expressing CNOT7 (BFP) and CNOT8 (mCherry) sgRNAs and analysed at two timepoints. The growth phenotype was calculated by measuring the relative depletion of the single-infected and double-infected cells. C Residual values from competitive growth experiments. Residuals were calculated as the difference between the expected phenotype of the double-positive population (based on summing the phenotypes of the single positive populations) and the observed phenotype of the double-positive population. Data represent three independent transductions. The baseline residual for three non-interacting-pairs (negative controls) are also shown (AIPL1&ACCSL, AIPL1&ASF1B, TTC7A/ACCSL). Residuals were compared with values for the control ACCSL/AIPL1 gene pair. Significance was calculated using a one-way ANOVA and adjusted for multiple testing using the Dunnett test. All interactions, except where indicated, had a P value < 0.01.
Fig. 3
Fig. 3. The FAM50A/FAM50B axis is a targetable synthetic lethal interaction.
A Expression of FAM50B across tumour and normal tissue. Data obtained from the TCGA. TPM; transcripts per million. Standard TCGA tumour abbreviations where used. B FAM50B expression inversely correlates with dependency on FAM50A. These data were derived from the analysis of CRISPR essentiality in 275 cancer lines. Lines were categorised by their FAM50B expression using an RPKM cutoff of 1 below which expression was defined as absent. The dependency of FAM50A is shown as scaled log2 fold-change of FAM50A gRNAs corrected for copy number variation across the cell lines used in this analysis. The p value was calculated with a two-tailed Mann–Whitney U test. Box-and-whisker plots show ×ばつ interquartile ranges and 5–95th percentiles, centres indicate medians. C Analysis of essentiality using isogenic cell lines. TOV21G-Cas9 and RKO-Cas9, which do not express FAM50B, were transduced with a lentivirus expressing a FAM50B cDNA (F50B+). A375-Cas9 cells express both FAM50A and FAM50B. A FAM50B knockout clone was generated for this cell line (F50B−) using CRISPR. Cells were transduced with a BFP+ lentivirus carrying a gRNA against FAM50A such that 50% of cells were transduced. Cell proportions were analysed at day 4 and 14. The relative fold-change of the infected population is shown. p values were obtained using the unpaired two-tailed t test, ****p < 0.0001. Experiments were performed on three separate occasions in triplicate. Error bars represent the mean and the standard error of the mean (SEM). D Clonogenic confirmation of the FAM50A/FAM50B genetic interaction. RKO and RKO-F50B+ (complemented with a FAM50B cDNA) were transduced with a lentivirus containing a doxycycline-inducible gRNA against FAM50A (see Methods). The cells also constitutively expressed Cas9 protein. Cells were seeded at 1000 cells/well; doxycycline (Dox; 0.1 μg/ml)/DMSO was added at 24 h. Cells were fixed and stained with crystal violet 9 days post seeding. This experiment is representative of three independent biological replicates.
Fig. 4
Fig. 4. Effect of FAM50A loss on TOV21G cell growth in vivo and mechanisms of resistance.
A Conditional disruption of FAM50A in FAM50B non-expressing TOV21G cells engineered (see Methods) to contain a dox-inducible FAM50A gRNA. B In vivo consequence of disrupting FAM50A in TOV21G cells on tumour growth. Data points represent the mean and SEM (see Methods). Dox diet was administered at the day 7 timepoint (arrow). Significance was defined using a two-tailed Mann–Whitney test by comparing the area under the curve for tumour growth in the Dox-fed and control groups. *p < 0.0001. These data are representative of two independent experiments. C An example of the FAM50A gRNA cut site showing the profile of editing events in a doxycycline (Dox)-treated tumour after regrowth. D Editing outcomes at the FAM50A gRNA cut site in tumours collected from untreated (left) and Dox-fed mice (right). The editing events were annotated using the Variant Effect Predictor (Ensembl). The Y axis is read depth/count.
Fig. 5
Fig. 5. Disruption of FAM50A/FAM50B results in micronucleus formation and apoptosis.
A Micronucleus levels in wildtype (WT), FAM50A null (F50A−) or FAM50B null (F50B−) A375 cells and WT or FAM50B-complemented (F50B+) RKO cells (left panel). Co-disruption of FAM50A/FAM50B results in a profound increase in micronucleus levels that can be rescued by FAM50B (F50B+) cDNA complementation (right panel). Cells were collected for analysis 7 days after transduction. The experiment performed on three separate occasions. B Representative images of micronuclei in A375 cell lines from the experiment in A. Scale bar represents 10 μM. C Analysis of apoptosis at day 7–8 using the CaspGlow assay (see Methods) in A375 cells and isogenic FAM50A (F50A−) or FAM50B (F50B−) knockout derivative lines. Early apoptosis: CaspGLOW positive/viable. Late apoptosis: CaspGLOW positive/non-viable. End apoptosis or necrosis: CaspGLOW negative/non-viable. Experiments were performed on three separate occasions in triplicate. For all panels error bars represent the mean and the standard error of the mean (SEM). p values were calculated using the unpaired two-tailed t test. ****p < 0.0001.

References

    1. Nijman SM. Synthetic lethality: general principles, utility and detection using genetic screens in human cells. FEBS Lett. 2011;585:1–6. doi: 10.1016/j.febslet.2010年11月02日4. - DOI - PMC - PubMed
    1. Ashworth A, Lord CJ. Synthetic lethal therapies for cancer: what’s next after PARP inhibitors? Nat. Rev. Clin. Oncol. 2018;15:564–576. doi: 10.1038/s41571-018-0055-6. - DOI - PubMed
    1. Farmer H, et al. Targeting the DNA repair defect in BRCA mutant cells as a therapeutic strategy. Nature. 2005;434:917–921. doi: 10.1038/nature03445. - DOI - PubMed
    1. Lord CJ, Ashworth A. PARP inhibitors: Synthetic lethality in the clinic. Science. 2017;355:1152–1158. doi: 10.1126/science.aam7344. - DOI - PMC - PubMed
    1. Ryan CJ, Bajrami I, Lord CJ. Synthetic lethality and cancer - penetrance as the major barrier. Trends Cancer. 2018;4:671–683. doi: 10.1016/j.trecan.201808003. - DOI - PubMed

Publication types

Cite

AltStyle によって変換されたページ (->オリジナル) /