This site needs JavaScript to work properly. Please enable it to take advantage of the complete set of features!
Skip to main page content
U.S. flag

An official website of the United States government

Dot gov

The .gov means it’s official.
Federal government websites often end in .gov or .mil. Before sharing sensitive information, make sure you’re on a federal government site.

Https

The site is secure.
The https:// ensures that you are connecting to the official website and that any information you provide is encrypted and transmitted securely.

NIH NLM Logo
Log in
Access keys NCBI Homepage MyNCBI Homepage Main Content Main Navigation
. 2020 May 21;12(5):122-138.
doi: 10.1093/intbio/zyaa009.

Modeling and measurement of signaling outcomes affecting decision making in noisy intracellular networks using machine learning methods

Affiliations

Modeling and measurement of signaling outcomes affecting decision making in noisy intracellular networks using machine learning methods

Mustafa Ozen et al. Integr Biol (Camb). .

Abstract

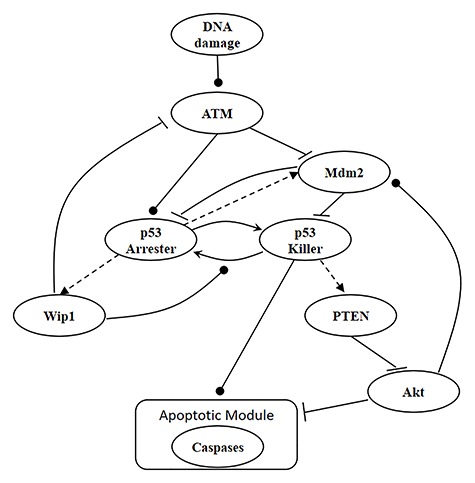
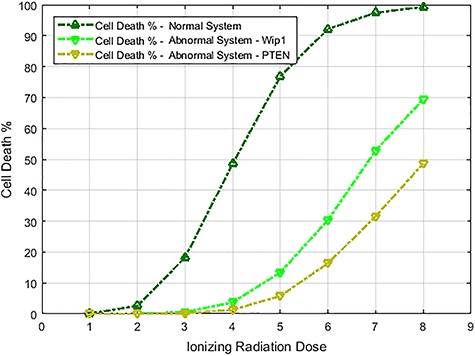
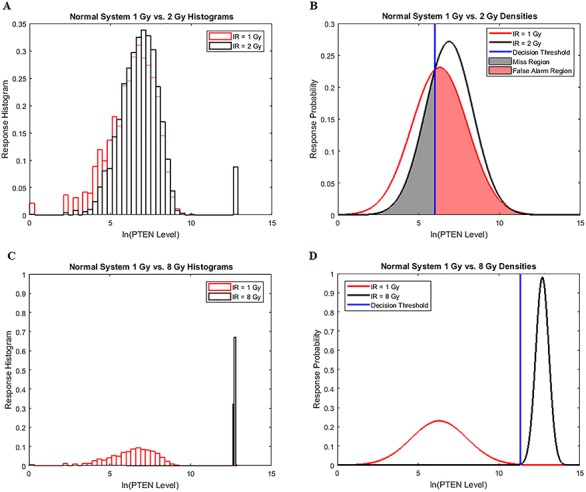
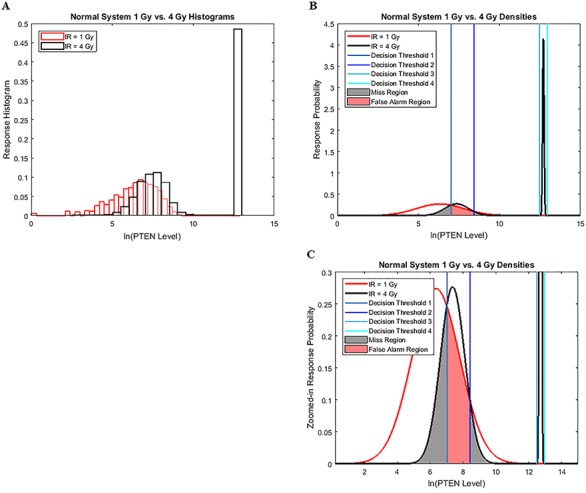
Characterization of decision-making in cells in response to received signals is of importance for understanding how cell fate is determined. The problem becomes multi-faceted and complex when we consider cellular heterogeneity and dynamics of biochemical processes. In this paper, we present a unified set of decision-theoretic, machine learning and statistical signal processing methods and metrics to model the precision of signaling decisions, in the presence of uncertainty, using single cell data. First, we introduce erroneous decisions that may result from signaling processes and identify false alarms and miss events associated with such decisions. Then, we present an optimal decision strategy which minimizes the total decision error probability. Additionally, we demonstrate how graphing receiver operating characteristic curves conveniently reveals the trade-off between false alarm and miss probabilities associated with different cell responses. Furthermore, we extend the introduced framework to incorporate the dynamics of biochemical processes and reactions in a cell, using multi-time point measurements and multi-dimensional outcome analysis and decision-making algorithms. The introduced multivariate signaling outcome modeling framework can be used to analyze several molecular species measured at the same or different time instants. We also show how the developed binary outcome analysis and decision-making approach can be extended to more than two possible outcomes. As an example and to show how the introduced methods can be used in practice, we apply them to single cell data of PTEN, an important intracellular regulatory molecule in a p53 system, in wild-type and abnormal cells. The unified signaling outcome modeling framework presented here can be applied to various organisms ranging from viruses, bacteria, yeast and lower metazoans to more complex organisms such as mammalian cells. Ultimately, this signaling outcome modeling approach can be utilized to better understand the transition from physiological to pathological conditions such as inflammation, various cancers and autoimmune diseases.

Keywords: Cell decision making; decision theory; machine learning; noise; p53 system; signaling errors.


Figures

Figure 1
Figure 1
A p53 system model [9]. Arrow-headed dashed lines represent positive transcriptional regulations, arrow-headed solid lines stand for protein transformations, circle-headed solid lines are activatory regulations, and hammer-headed solid lines represent inhibitory regulations. All the molecules and the interactions between them are described in the main body of the paper.
Figure 2
Figure 2
Cell death percentage versus IR dose in both normal and abnormal p53 systems. The dark green curve at the top represents a normal p53 system with no perturbation, whereas the other two curves correspond to p53 systems behaving abnormally due to Wip1 or PTEN perturbations.
Figure 3
Figure 3
Univariate decision-making and signaling outcome analysis in the normal p53 system based on PTEN response distributions. (A) Histograms of PTEN levels of cells under IR = 1 and 2 Gy doses. (B) Gaussian PDFs for PTEN levels of cells under IR = 1 and 2 Gy doses, together with the optimal maximum likelihood decision threshold which minimizes the total decision error probability. (C) Histograms of PTEN levels of cells under IR = 1 and 8 Gy doses. (D) Gaussian PDFs for PTEN levels of cells under IR = 1 and 8 Gy doses, together with the optimal maximum likelihood decision threshold which minimizes the total decision error probability.
Figure 4
Figure 4
Univariate decision making and signaling outcome analysis in the normal p53 system when a PTEN response distribution is bimodal. (A) Histograms of PTEN levels of cells under IR = 1 and 4 Gy doses. (B) A Gaussian PDF for PTEN levels of cells under IR = 1 Gy and a mixture of two Gaussian PDFs for PTEN levels of cells under IR = 4 Gy doses, together with the optimal maximum likelihood decision thresholds which minimize the total decision error probability. (C) Zoomed-in view of panel B.
Figure 5
Figure 5
Univariate decision-making and signaling outcome analysis in an abnormal p53 system, with increased Wip1 synthesis rate, based on PTEN response distributions. (A) Gaussian PDFs for PTEN levels of abnormal cells under IR = 1 and 2 Gy doses, together with the decision threshold of normal cells. This implies that in abnormal cells the previous decision threshold is erroneously used [1]. As discussed later, this increases decision error probabilities, a behavior that can be anticipated from abnormal cells. (B) A Gaussian PDF for PTEN levels of abnormal cells under IR = 1 Gy dose and a mixture of two Gaussian PDFs for PTEN levels of abnormal cells under IR = 8 Gy dose, together with the decision threshold of normal cells.
Figure 6
Figure 6
Decision error probabilities for several low IR versus high IR scenarios. The ‘Abnormal System—PTEN’ legend refers to a p53 system whose PTEN synthesis rate is decreased by 50%, compared to its nominal value. The ‘Abnormal System—Wip1’ legend refers to a p53 system whose Wip1 synthesis rate is increased by 50%, compared to its nominal value. Smaller decision error probabilities in the normal system are noteworthy.
Figure 7
Figure 7
Empirical and theoretical ROC curves for both normal and abnormal p53 systems. The theoretical ROC curves labeled by しろいしかく are obtained from the Gaussian and mixture of Gaussian data models and formulas whose parameters are estimated from the data, whereas the empirical ROC curves labeled by ◊ are obtained directly from the data. We observe that the theoretical and empirical ROCs are nearly the same. Note that Threshold = ln(PTEN Level) in the figures. (A) ROC curves of 1 vs. 2 Gy and 1 vs. 8 Gy radiation scenarios for the normal system. (B) ROC curves of 1 vs. 2 Gy and 1 vs. 8 Gy radiation scenarios for the Wip1-perturbed abnormal system.
Figure 8
Figure 8
Bivariate decision-making and signaling outcome analysis in the normal p53 system based on PTEN response distributions. (A) Bivariate Gaussian PDFs for PTEN levels of cells at the first hour and the 30th hour, under IR = 1 and 2 Gy doses. (B) Top view of the two bivariate Gaussian PDFs. (C) Top contour view of the two bivariate Gaussian PDFs, together with the optimal maximum likelihood decision threshold curve which minimizes the total decision error probability.
Figure 9
Figure 9
Decision error probabilities versus time in the normal p53 system: a single versus multiple time point study. (A) PE as a function of time for the 1 vs. 2 Gy radiation scenario, computed using only the PTEN data of a single, N = 1, individual time instant. This assumes at any given time, decision is made based on the data of that time only. Having a minimum error probability at the 20th hour is noteworthy. (B) PE as a function of time for the 1 vs. 2 Gy radiation scenario, computed using the PTEN data of N time instants, N = 1, 2,..., 8 (N = 1 means the PTEN data of the first hour, N = 2 refers to the PTEN data of the first and the 10th hours, N = 3 indicates the PTEN data of the first, 10th, 20th hours, etc.). This assumes, at any given time, decision is made based on the data of that time, plus the data of the previous time instants, which means accumulating the data to make a decision. It is observed that PE first decreases, and after a certain point, it remains nearly constant. (C) Condition numbers of formula image and formula image the formula image covariance matrices of the data for the two hypotheses H0 and H1, for IR = 1 and 2 Gy, respectively, as N increases from 2 to 8. When N increases, condition numbers of both of the covariance matrices formula image and formula image increase. On the other hand, a large condition number for a covariance matrix implies large correlations among some of its random variables. Therefore, as time evolves after a certain point, the suggested sequential decision-maker incorporates a new observation that is correlated with the previously used observations. The correlation does not allow the decision error probability PE to decrease beyond a certain point, although N constantly increases.
Figure 10
Figure 10
Comparison of the histograms of cell PTEN levels at the 20th and 70th hours under IR = 1 and 2 Gy doses in the normal p53 system. (A) Histograms of the 20th hour PTEN data under IR = 1 and 2 Gy doses, which show less overlap. (B) Histograms of the 70th hour PTEN data under IR = 1 and 2 Gy doses, which show more overlap.
Figure 11
Figure 11
Effect of heterogeneity of initial values and pseudo-first-order dephosphorylation reaction rates on PTEN histograms. Histograms of PTEN levels of cells under IR = 2 Gy dose, with σ = 0, 0.2, 0.5 and 1.
Figure 12
Figure 12
Response PDFs of a hypothetical molecule called MOL whose level entails a ternary decision-making process with three signaling outcomes. Shaded tail areas with the same color represent decision error regions associated with each specific hypothesis. Assuming equi-probable hypotheses, optimal maximum likelihood decision thresholds which minimize the total decision error probability are shown by vertical blue lines at the points of intersection of the probability density functions.

References

    1. Habibi I, Cheong R, Lipniacki T et al. . Computation and measurement of cell decision making errors using single cell data. PLoS Comput Biol 2014;13:e1005436. doi: 10.1371/journal.pcbi.1005436. - DOI - PMC - PubMed
    1. Kolitz SE, Lauffenburger DA. Measurement and modeling of signaling at the single-cell level. Biochemistry 2012;51:7433–43. doi: 10.1021/bi300846pPMID: 22954137. - DOI - PMC - PubMed
    1. Cheong R, Rhee A, Wang CJ et al. . Information transduction capacity of noisy biochemical signaling networks. Science 2011;334:354–8. doi: 10.1126/science.1204553PMID: 21921160. - DOI - PMC - PubMed
    1. Balazsi G, Oudenaarden A, Collins JJ. Cellular decision making and biological noise: from microbes to mammals. Cell 2011;144:910–25. - PMC - PubMed
    1. Vousden KH, Prives C. Blinded by the light: the growing complexity of p53. Cell 2009;137:413–31. doi: 10.1016/j.cell.2009年04月03日7PMID: 19410540. - DOI - PubMed

Publication types

Cite

AltStyle によって変換されたページ (->オリジナル) /