This site needs JavaScript to work properly. Please enable it to take advantage of the complete set of features!
Skip to main page content
U.S. flag

An official website of the United States government

Dot gov

The .gov means it’s official.
Federal government websites often end in .gov or .mil. Before sharing sensitive information, make sure you’re on a federal government site.

Https

The site is secure.
The https:// ensures that you are connecting to the official website and that any information you provide is encrypted and transmitted securely.

NIH NLM Logo
Log in
Access keys NCBI Homepage MyNCBI Homepage Main Content Main Navigation
. 2019 May;224(4):1677-1695.
doi: 10.1007/s00429-019-01859-z. Epub 2019 Mar 30.

Variability and directionality of inferior olive neuron dendrites revealed by detailed 3D characterization of an extensive morphological library

Affiliations

Variability and directionality of inferior olive neuron dendrites revealed by detailed 3D characterization of an extensive morphological library

Nora Vrieler et al. Brain Struct Funct. 2019 May.

Abstract

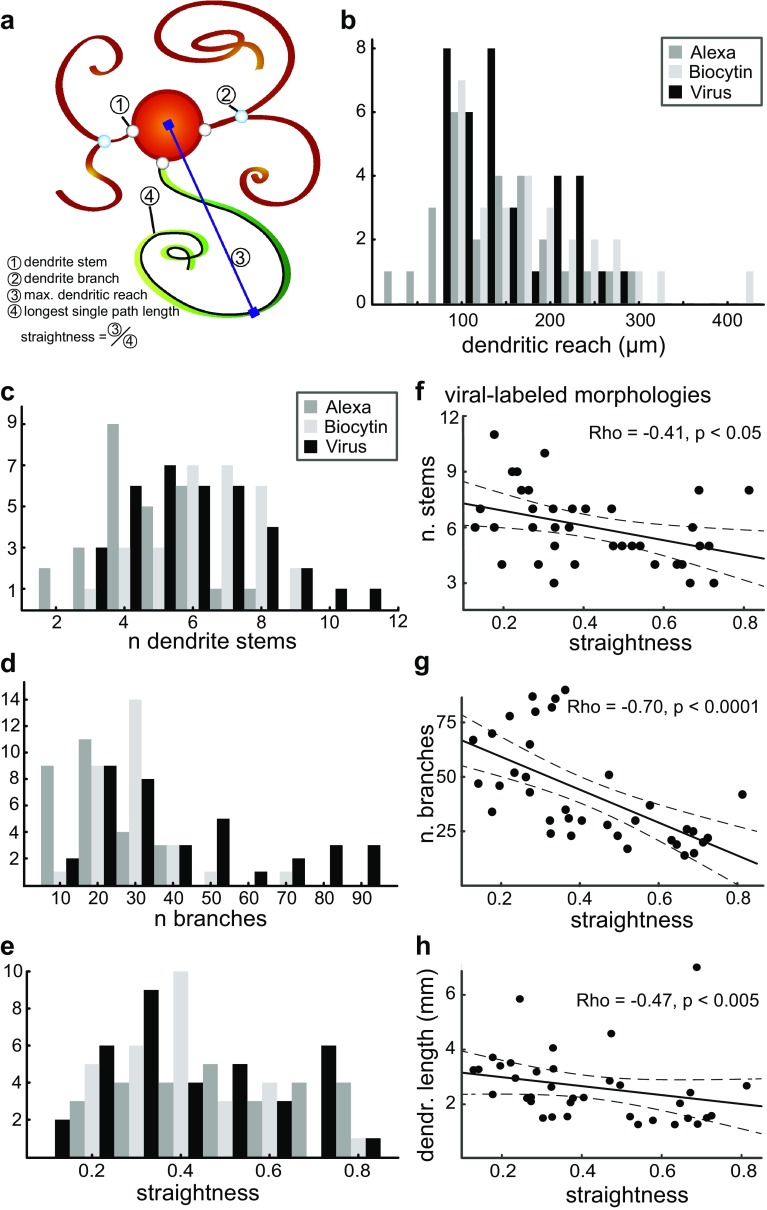
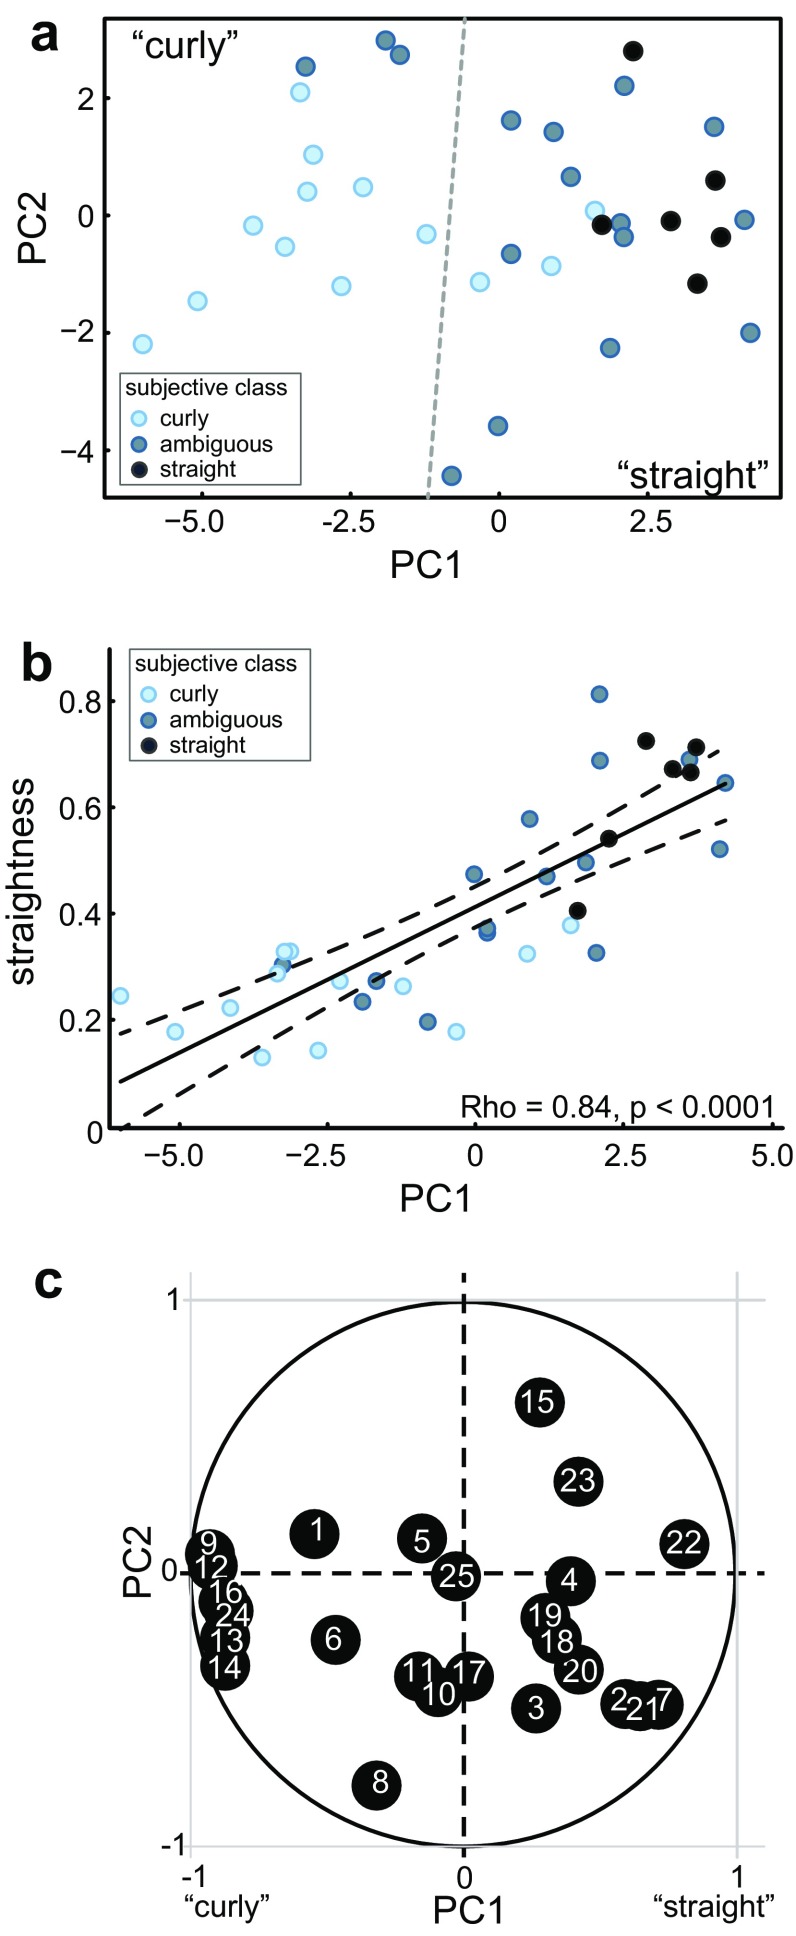
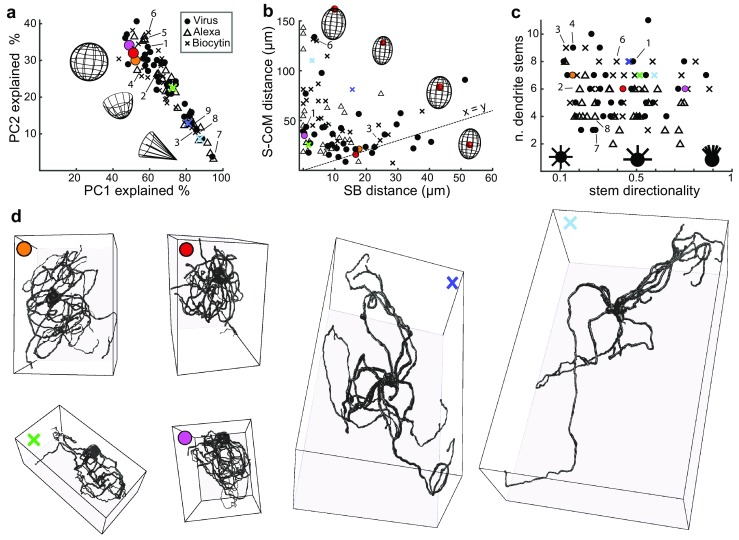
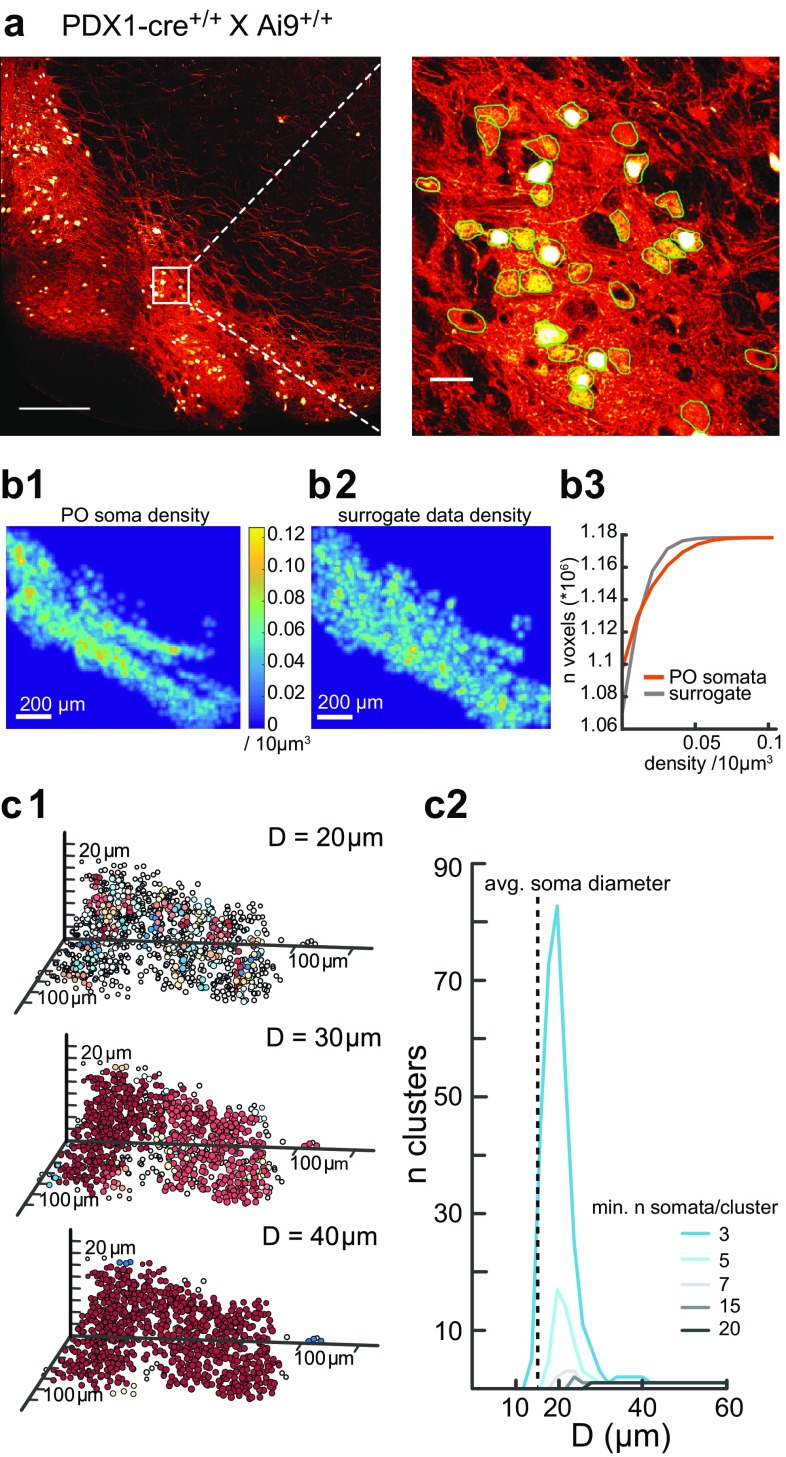
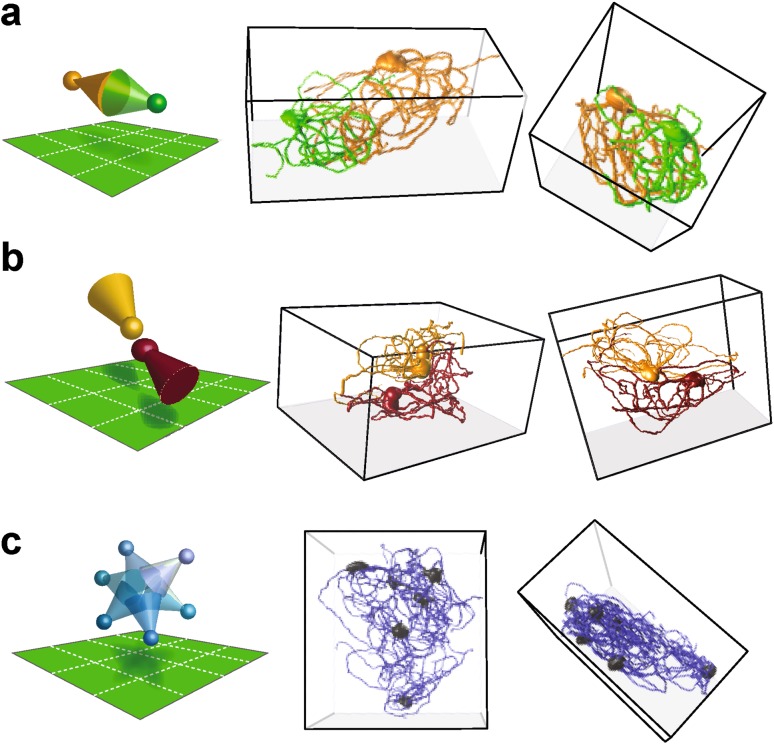
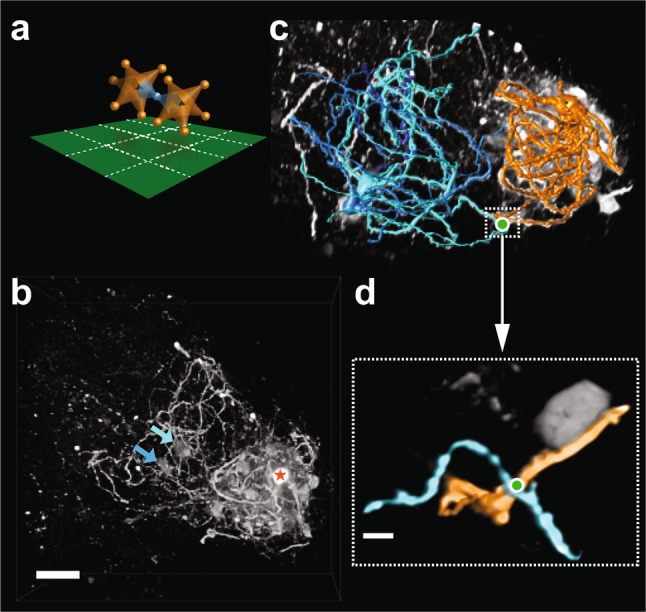
The inferior olive (IO) is an evolutionarily conserved brain stem structure and its output activity plays a major role in the cerebellar computation necessary for controlling the temporal accuracy of motor behavior. The precise timing and synchronization of IO network activity has been attributed to the dendro-dendritic gap junctions mediating electrical coupling within the IO nucleus. Thus, the dendritic morphology and spatial arrangement of IO neurons governs how synchronized activity emerges in this nucleus. To date, IO neuron structural properties have been characterized in few studies and with small numbers of neurons; these investigations have described IO neurons as belonging to two morphologically distinct types, "curly" and "straight". In this work we collect a large number of individual IO neuron morphologies visualized using different labeling techniques and present a thorough examination of their morphological properties and spatial arrangement within the olivary neuropil. Our results show that the extensive heterogeneity in IO neuron dendritic morphologies occupies a continuous range between the classically described "curly" and "straight" types, and that this continuum is well represented by a relatively simple measure of "straightness". Furthermore, we find that IO neuron dendritic trees are often directionally oriented. Combined with an examination of cell body density distributions and dendritic orientation of adjacent IO neurons, our results suggest that the IO network may be organized into groups of densely coupled neurons interspersed with areas of weaker coupling.

Keywords: Brainstem; Dendritic morphometry; Network structure; Neuron reconstructions; Olivo-cerebellar system; Sparse viral labeling.


Conflict of interest statement

Conflict of interest

The authors declare that they have no conflict of interest.

Research involving human participants and/or animals

No human participants. All animal experimental procedures were approved by the Hebrew University’s Animal Care and Use Committee, and the animal experiment committee of the Royal Netherlands Academy of Arts and Sciences (DEC-KNAW) which follows the European guidelines for the care and use of laboratory animals (Council Directive 86/6009/EEC).

Informed consent

Not applicable.

Figures

Fig. 1
Fig. 1
Fluorescent labeling of IO neurons reveals complex morphologies. a Maximal projection of a 100 μm-thick confocal image stack of a coronal brain stem slice labeled sparsely by viral transfection (1:3500 dilution of cre-expression virus). IO borders are marked with a white dotted line. Scale bar 100 μm. b as in a, but with 1:4000 dilution. c–e Confocal image z-stacks exemplifying "very curly" IO neurons as revealed by viral (c), Alexa-594 (d) or biocytin (e) staining. Scale bar 20 μm. f Examples of reconstructed morphologies from the three data sets (as in c–e) ranging from "very curly" (left column, same examples as shown in c–e) to "straight" (rightmost column). Note that the scale varies between subpanels and perspective; scale bars represent 20 μm in the xy plane. Encircled numbers denote reconstruction IDs as referred to in the text. g A composite drawing showing the shape and orientation of a selection of the morphologies within the volume of the IO. Note the presence of curly and straight neurons in all subnuclei (abbreviations: PO principal olive, DAO dorsal accessory olive, MAO medial accessory olive)
Fig. 2
Fig. 2
Morphological properties of IO neurons quantified. a Schematic illustration of some of the basic morphological parameters used to characterize the dendritic morphologies. Maximal dendritic reach is defined as the furthest reach of the dendritic tree away from the soma; the longest single path length is defined as the longest soma-to-tip path length on a dendritic tree; and straightness is defined as the maximal dendritic reach divided by the longest single dendrite path length. For a list of all morphometric parameters and their definitions, see Table 1. Distributions of maximal dendritic reach (b), number of dendrite stems emerging from the soma (c), number of branch points on the dendritic trees (d) and straightness (e) in each of the three data sets; shadings refer to morphologies recovered using different labeling methods as indicated. Distributions of number of dendrite stems (f), number of branch points (g) and total dendritic length (h) with respect to straightness in the viral-labeled data; the same distributions in the Alexa- and biotin-labeled data sets are displayed in Supplementary Fig. 1. Reported correlation statistics represent the strength and direction (Rho) and significance level (p) calculated using Spearman’s rank correlation test (see "Methods"). Correlations between straightness and all other morphological measures are reported in the right half of Table 2 for each of the three data sets
Fig. 3
Fig. 3
Algorithmic classification does not reveal clearly separated clusters. a Algorithmic classification shown as a scatter along the first two principal components (PCs) of separation for the viral-labeled data set. The grey dashed line marks the division into "curly" and "straight" groups as determined by a K-means algorithm; fill color represents subjective classification, as indicated. Note that the separation along the first principal component (PC1) appears to correspond to the subjective classification into morphological subtypes: subjectively "straight" neurons occupy the far-right side of the distribution while "ambiguous" and "curly" neurons are found in the middle and to the left. The slight mismatch between the subjective and algorithmic classification into "curly" and "straight" morphological types is another indication that seeking a quantitative justification for the subjective typification is futile. b Correlation of the main axis of separation to "straightness" in the viral-labeled data set; fill color represents subjective classification as indicated. c Relative contributions of the 25 morphometric parameters to the principal component separation in the viral-labeled data set. Numbers in circles correspond to the measures as listed in Table 1. The closer a parameter is to 1, the more it contributed to the separation in the PC space, in the direction indicated by its position within the unit circle; a parameter located at the origin did not contribute to the PC separation
Fig. 4
Fig. 4
IO neuron morphologies with spherical dendritic fields and somata in the center are rare. a Scatter plot showing the percentage of variance explained by the first two principal components of the decomposition of IO neuron morphologies. The schematic line drawing insets in the plot illustrate the transition from "spherical" to "directional" dendritic field shapes. Colored points correspond to examples shown in panel d, while numbered points refer to examples shown in Fig. 1f. Symbols correspond to morphologies from the three datasets as indicated. b Scatter plot showing the distance from the soma to the extrapolated border of the neuron’s dendritic field (soma-border (SB) distance) relative to the distance from the soma to the center of mass of the dendritic arbor (S-CoM distance). Schematic line drawings illustrate the transition from "eccentric" to "centered" somata within an idealized, ovaloid dendritic field shape. Dotted line depicts unity, highlighting that the majority of neurons have somata much closer to the border than to the center of the volume they occupy. Numbers, symbols and colors used as in a. c Distribution of dendritic stem directionality with respect to number of stems. Insets in the plot schematically depict the variation from isomorphic (left) to directional (right). Note that the morphologies shown as examples in Figs. 1f and 4d have mostly isomorphically extending dendrite stems. Numbers, symbols and colors used as in a. d Additional examples of IO neuron morphologies. Colored circles denote morphologies from the viral-labeled data set; colored x’s denote morphologies from the biotin-labeled data. The orange and red morphologies are the only two examples in our library in which dendrites densely surround the soma on all sides. The morphologies marked with green and pink exemplify extreme (though not infrequent) examples of soma eccentricity. The morphologies marked with blue and cyan are examples of extremely extensive IO neuron morphologies with dendritic trees spreading far and wide in almost every direction around the soma. Note that the scale in the reconstructions varies according to viewing angle; somata are 15–18 μm in diameter
Fig. 5
Fig. 5
Anatomical clusters cannot be detected in the distribution of IO neuron somata. a Fluorescent labeling of all IO neuron somata. Left panel: coronal cross-section showing a full hemi-olive (scale bar 200 μm); right panel: magnification of the area delineated with a white square on the left (scale bar 25 μm). Detected somata are outlined in thin green lines; black holes are blood vessels. b Density distribution of somata. b1 Soma density shown in a caudal view projection for the principal olive (PO). b2 Same as b1 but for shuffled surrogate data. b3 Comparison of soma densities per 10μm3 voxel. Note that while the PO data has more high-density "hotspots" as well as "empty" regions (see "Methods"), density gradients are too weak to delineate anatomical clusters of somata. c Detection of clusters using the DBSCAN clustering algorithm (see "Methods"), in which cluster membership is defined as a group of points where each point is at most D μm removed from another point in the cluster. c1 3D-representation of clustering in the medial accessory olive (MAO) for different values of D as indicated (the minimal number of somata per cluster was set to 3). c2 Total number of distinct clusters for different minimal cluster sizes as indicated by color-code. Dashed line represents average soma diameter. Note that multiple clusters are only detected at very short (< 20 μm) inter-soma distances, while the entire IO becomes a single cluster at inter-soma distance as short as 40 μm
Fig. 6
Fig. 6
IO neuron dendritic tree arrangements relative to their neighbors suggest anatomical clustering of dendro-dendritic connectivity in the network. Schematic illustrations of dendritic field positioning are shown on the left, while the two right panels show reconstructed morphologies from two different viewing angles (a–c). a A pair of neurons with overlapping, directional dendritic trees. b A pair of neurons with proximally placed somata, but non-overlapping dendritic fields. c A group of neurons with somata residing at the outer rim of their overlapping dendritic fields
Fig. 7
Fig. 7
Example suggesting tight within-cluster coupling and weak inter-cluster coupling. a Schematic illustration of a "bridge neuron" (blue) providing weak coupling between two clusters (orange). b Confocal image stack z-projection showing a single directly labeled IO neuron (marked with an orange star) and a dense cluster of indirectly labeled neighbors, as well as two indirectly labeled neurons with somata residing outside the cluster (marked with blue and cyan arrows). Scale bar 50 μm. c Reconstructions of the neurons marked in b, revealing a point of close proximity between their dendrites. d High-magnification confocal z-stack image showing the area marked with a white box in c. Green dot marks a putative GJ-connection between the primary labeled neuron (orange-colored dendrite) and a "bridge neuron" (blue-colored dendrite). Scale bar 5 μm

References

    1. Ankri L, Yarom Y, Uusisaari MY. Slice it hot: acute adult brain slicing in physiological temperature. J Vis Exp. 2014;92:e52068. - PMC - PubMed
    1. Ausim Azizi S. And the olive said to the cerebellum: organization and functional significance of the olivo-cerebellar system. Neuroscientist. 2007;13:616–625. doi: 10.1177/1073858407299286. - DOI - PubMed
    1. Benardo LS, Foster RE. Oscillatory behavior in inferior olive neurons: mechanism, modulation, cell aggregates. Brain Res Bull. 1986;17:773–784. doi: 10.1016/0361-9230(86)90089-4. - DOI - PubMed
    1. Blenkinsop TA, Lang EJ. Block of inferior olive gap junctional coupling decreases Purkinje cell complex spike synchrony and rhythmicity. J Neurosci. 2006;26:1739–1748. doi: 10.1523/JNEUROSCI.3677-05.2006. - DOI - PMC - PubMed
    1. Chaumont J, Guyon N, Valera AM, et al. Clusters of cerebellar Purkinje cells control their afferent climbing fiber discharge. Proc Natl Acad Sci. 2013;110:16223–16228. doi: 10.1073/pnas.1302310110. - DOI - PMC - PubMed
Cite

AltStyle によって変換されたページ (->オリジナル) /