This site needs JavaScript to work properly. Please enable it to take advantage of the complete set of features!
Skip to main page content
U.S. flag

An official website of the United States government

Dot gov

The .gov means it’s official.
Federal government websites often end in .gov or .mil. Before sharing sensitive information, make sure you’re on a federal government site.

Https

The site is secure.
The https:// ensures that you are connecting to the official website and that any information you provide is encrypted and transmitted securely.

NIH NLM Logo
Log in
Access keys NCBI Homepage MyNCBI Homepage Main Content Main Navigation
. 2018 Nov;55(6):2963-2975.
doi: 10.1111/1365-2664.13154. Epub 2018 Mar 26.

The roles of migratory and resident birds in local avian influenza infection dynamics

Affiliations

The roles of migratory and resident birds in local avian influenza infection dynamics

Simeon Lisovski et al. J Appl Ecol. 2018 Nov.

Abstract

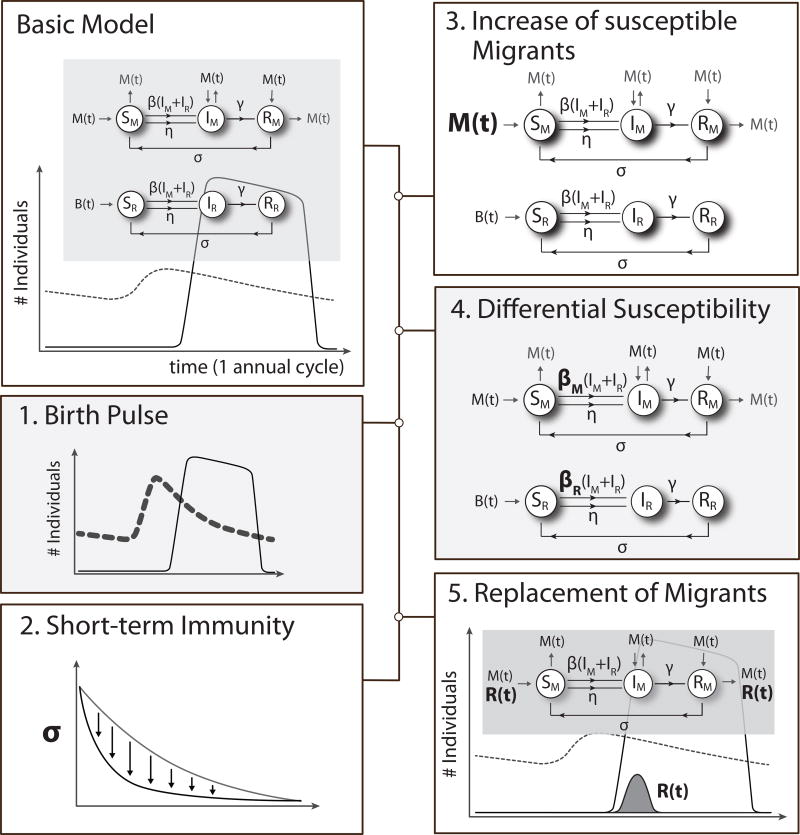
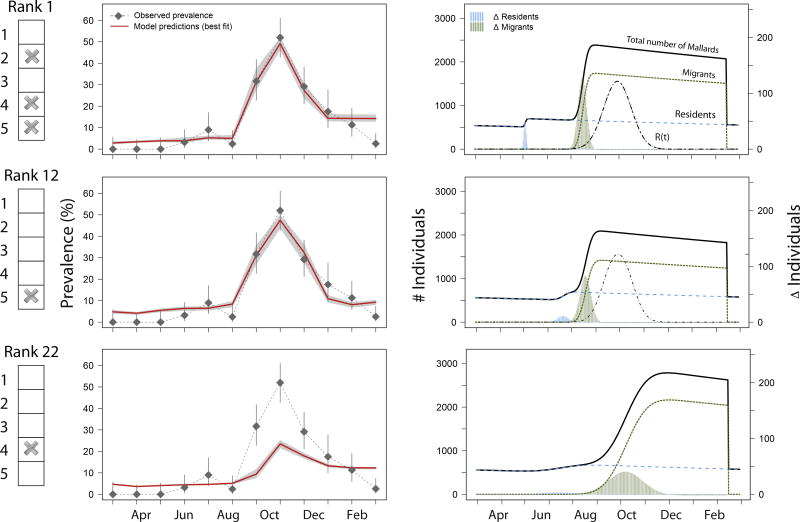
Migratory birds are an increasing focus of interest when it comes to infection dynamics and the spread of avian influenza viruses (AIV). However, we lack detailed understanding migratory birds' contribution to local AIV prevalence levels and their downstream socio-economic costs and threats.To explain the potential differential roles of migratory and resident birds in local AIV infection dynamics, we used a susceptible-infectious-recovered (SIR) model. We investigated five (mutually non- exclusive) mechanisms potentially driving observed prevalence patterns: 1) a pronounced birth pulse (e.g. the synchronised annual influx of immunologically naïve individuals), 2) short-term immunity, 3) increase of susceptible migrants, 4) differential susceptibility to infection (i.e. transmission rate) for migrants and residents, and 5) replacement of migrants during peak migration.SIR models describing all possible combinations of the five mechanisms were fitted to individual AIV infection data from a detailed longitudinal surveillance study in the partially migratory mallard duck (Anas platyrhynchos). During autumn and winter, the local resident mallard community also held migratory mallards that exhibited distinct AIV infection dynamics.Replacement of migratory birds during peak migration in autumn was found to be the most important mechanism driving the variation in local AIV infection patterns. This suggests that a constant influx of migratory birds, likely immunological naïve to locally circulating AIV strains, is required to predict the observed temporal prevalence patterns and the distinct differences in prevalence between residents and migrants.Synthesis and applications. Our analysis reveals a key mechanism that could explain the amplifying role of migratory birds in local avian influenza virus infection dynamics; the constant flow and replacement of migratory birds during peak migration. Aside from monitoring efforts, in order to achieve adequate disease management and control in wildlife - with knock-on effects for livestock and humans, - we conclude that it is crucial, in future surveillance studies, to record host demographical parameters such as population density, timing of birth and turnover of migrants.

Keywords: Avian influenza; Epidemiology; Host-pathogen interactions; Immunity; Mallard; Migratory birds; Migratory connectivity; SIR.


Figures

Figure 1
Figure 1
The structure of the basic model and the main differences of the modifications that are based on five potential mechanisms that may drive local AIV infection dynamics in wild birds. For the basic model, the grey box shows the flowchart of the movement of migrant (M) and resident (R) individuals between the susceptible (S), infectious (I) and recovered (R) compartments as described by the model equations 1–6. Natural mortality (m) is not depicted, but is assumed to occur within all three compartments and at the same rate for all individuals (i.e. resident and migrant). The graph below the grey box shows the general annual demographic dynamics of resident mallards (dashed line) and migratory mallards (solid line) visiting the study site during the annual cycle. For the 1st model modification, the bold dashed line shows the potential dynamics of the resident population with a more pronounced birth pulse B(t). The 2nd model modification assumes a reduced immune rate (σ) and thus a faster loss of immunity against AIV infections. In the 3rd model modification, relatively more migrants enter into the pool of susceptible (S) individuals. In the 4th model modification, the transmission rate (β) is modelled separately and has different values for migrants (βM) and residents (βR). For the 5th model modification, the R(t) curve describes the amount and the shape at which migrants within the infectious (I) and the recovered (R) pool are replaced by new susceptible migrants.
Figure 2
Figure 2
Ranked model scenarios based on median WAIC (‘model cost’) of the model fit. White bars indicate scenarios with a single modification on top of the basic model. The black bar shows the basic model without any modification. Models with lower WAIC represent better model fits. The bars represent the median WAIC over 25 independent MCMC chains with random selection of initial priors within the range of the respective parameter. Error bars indicate 95% confidence intervals. The inclusion of the five model modifications to the basic model are shown below the bar plot, with a cross indicating that the particular modification was included in the scenario. The model scenarios are 1) Birth Pulse, 2) Short-term immunity, 3) Increase of Susceptible Migrants, 4) Differential Susceptibility and 5) Replacement of Migrants. Below, all estimated parameter values across the 32 scenarios are shown with the 50% (circle) and the 10% and 90% percentiles of the posterior distributions (10,000 iterations). The grey areas between the dashed lines indicate the pre-set parameter ranges. In case of the transmission rate (β) and immune rate (σ), the dotted lines indicate the reduced boundaries of the parameter for the 4th differential susceptibility and the 2nd short-term immunity modifications.
Figure 3
Figure 3
Results of three model scenarios: the best-ranked scenario (with 3rd, 4th and 5th modification, Rank 1), the scenario with the most influential modification only (5th modification, Rank 12), and the scenario with the second most influential modification only (4th modification; Rank 22). The left column shows which of the model modifications were included in the respective scenario. The middle column shows the observed AIV prevalence levels (±95% CI) at the study site (dashed line with diamond symbols), and the model prediction (bold line) of the best fitting model with the respective modifications. Grey area around model predictions indicate the sensitivity range of the fit (e.g. ±95% CI). The underlying demography for each depicted scenario is shown in the right column with absolute numbers of individuals (black line) consisting of migrants (dotted line) and residents (dashed line). The replaced migrants (R(t)) is also shown as the absolute number of individuals replaced at time t (in days). Additionally, the rate of change in individuals (∆ Individuals) is shown for residents indicating birth (light grey bars) and migrants indicating initial arrival (dark grey bars).
Figure 4
Figure 4
The parameters of the best ranked model scenario (matrix diagonal) and the correlation matrix of all parameters from the last 2.500 MCMC iterations. The intensity of grey and shape of the ellipsoids represent the strength (dark colour and narrow ellipse represent correlation coefficients close to 1 or −1) and direction of the correlation.

References

    1. Alexander DJ. An overview of the epidemiology of avian influenza. Vaccine. 2007;25:5637–5644. - PubMed
    1. Altermatt F. Tell me what you eat and I'll tell you when you fly: diet can predict phenological changes in response to climate change. Ecology Letters. 2010;13:1475–1484. - PubMed
    1. Altizer S, Bartel R, Han BA. Animal Migration and Infectious Disease Risk. Science. 2011;331:296–302. - PubMed
    1. Altizer S, Dobson A, Hosseini P, Hudson P, Pascual M, Rohani P. Seasonality and the dynamics of infectious diseases. Ecology Letters. 2006;9:467–484. - PubMed
    1. Avril A, Grosbois V, Latorre-Margalef N, Gaidet N, Tolf C, Olsen B, Waldenstrom J. Capturing individual-level parameters of influenza A virus dynamics in wild ducks using multistate models. Journal of Applied Ecology. 2016;53:1289–1297.

LinkOut - more resources

Cite

AltStyle によって変換されたページ (->オリジナル) /