This site needs JavaScript to work properly. Please enable it to take advantage of the complete set of features!
Skip to main page content
U.S. flag

An official website of the United States government

Dot gov

The .gov means it’s official.
Federal government websites often end in .gov or .mil. Before sharing sensitive information, make sure you’re on a federal government site.

Https

The site is secure.
The https:// ensures that you are connecting to the official website and that any information you provide is encrypted and transmitted securely.

NIH NLM Logo
Log in
Access keys NCBI Homepage MyNCBI Homepage Main Content Main Navigation
doi: 10.7554/eLife.11888.

Recurring patterns in bacterioplankton dynamics during coastal spring algae blooms

Affiliations

Recurring patterns in bacterioplankton dynamics during coastal spring algae blooms

Hanno Teeling et al. Elife. .

Abstract

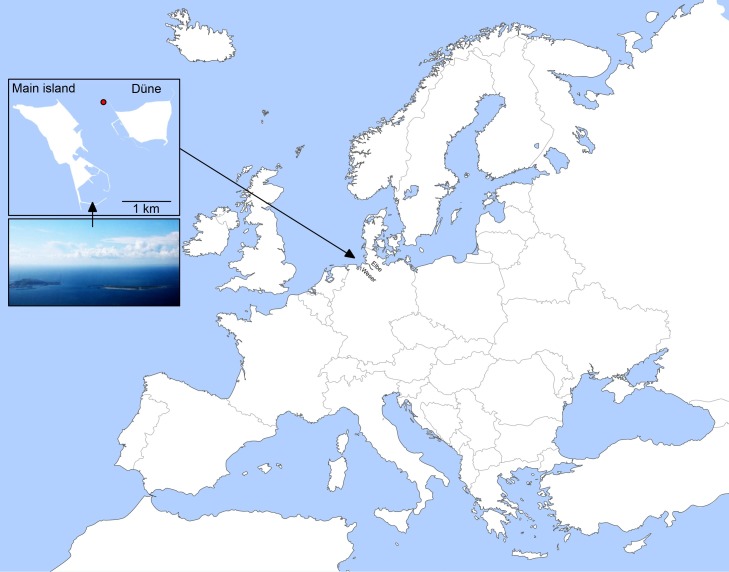
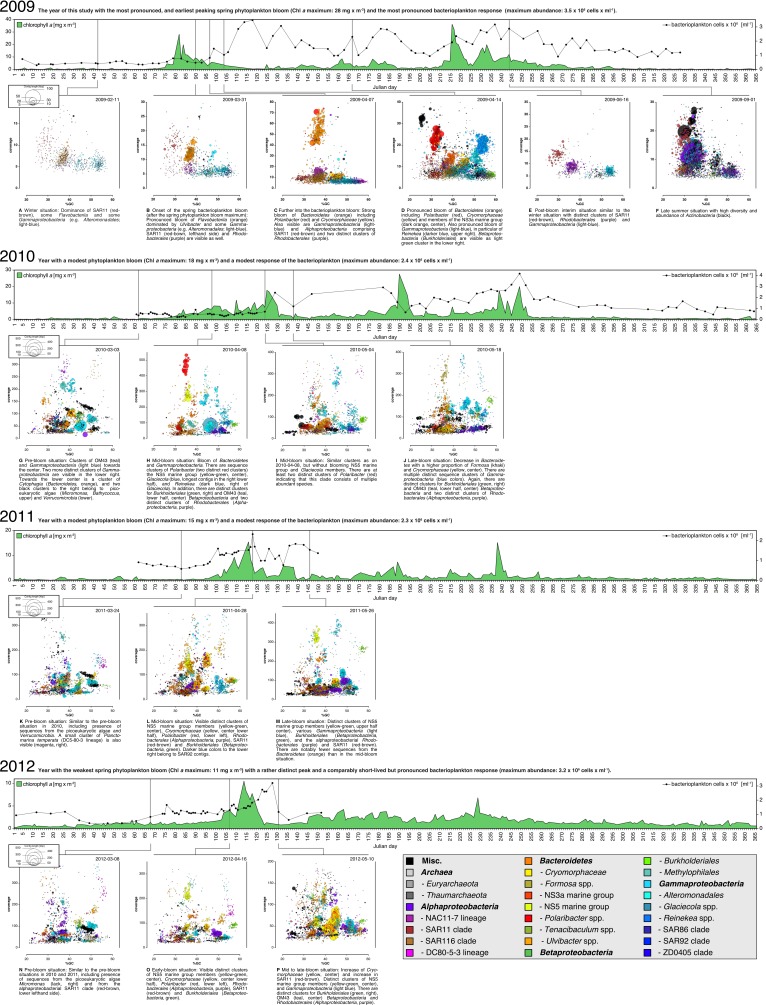
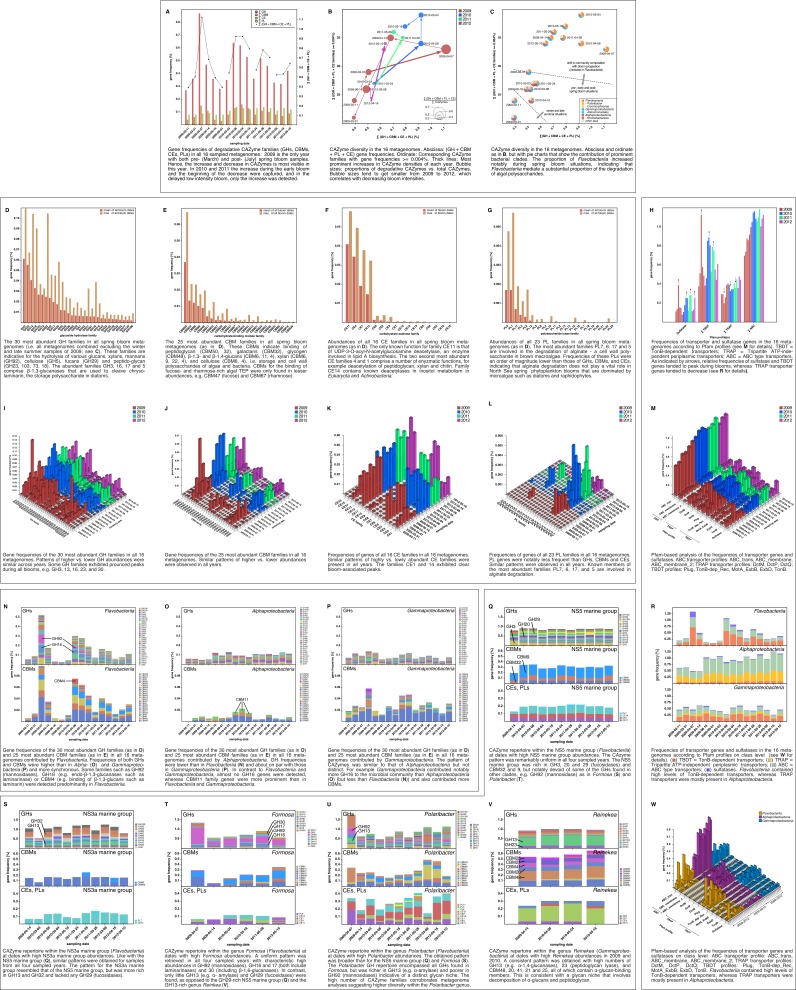
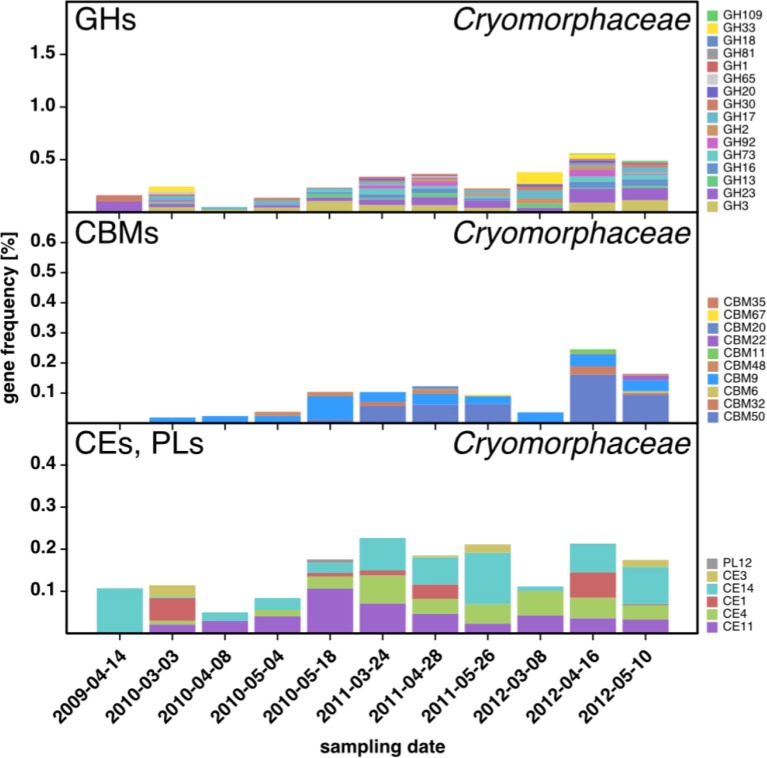
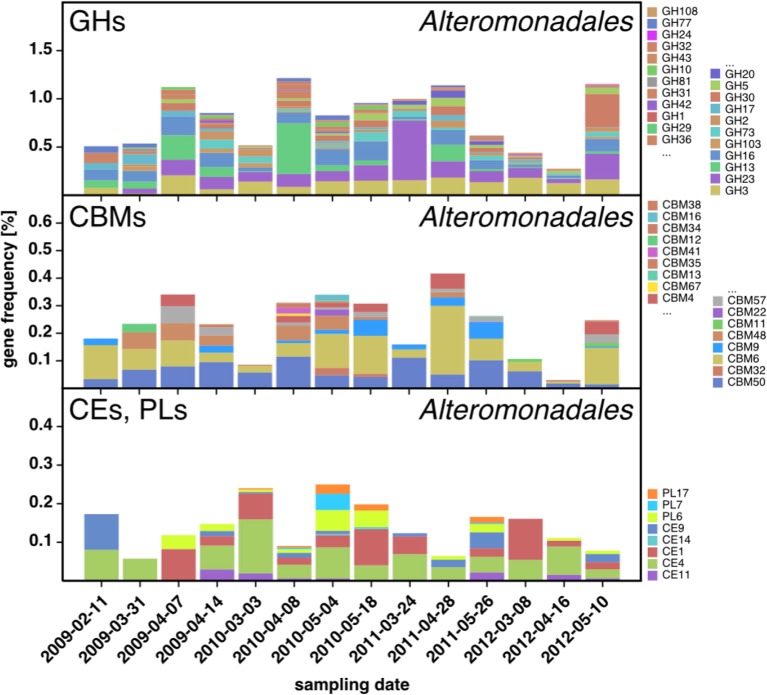
A process of global importance in carbon cycling is the remineralization of algae biomass by heterotrophic bacteria, most notably during massive marine algae blooms. Such blooms can trigger secondary blooms of planktonic bacteria that consist of swift successions of distinct bacterial clades, most prominently members of the Flavobacteriia, Gammaproteobacteria and the alphaproteobacterial Roseobacter clade. We investigated such successions during spring phytoplankton blooms in the southern North Sea (German Bight) for four consecutive years. Dense sampling and high-resolution taxonomic analyses allowed the detection of recurring patterns down to the genus level. Metagenome analyses also revealed recurrent patterns at the functional level, in particular with respect to algal polysaccharide degradation genes. We, therefore, hypothesize that even though there is substantial inter-annual variation between spring phytoplankton blooms, the accompanying succession of bacterial clades is largely governed by deterministic principles such as substrate-induced forcing.

Keywords: bacterial decomposition of algal biomass during blooms; coastal shelf spring phytoplankton blooms; ecology; infectious disease; marine bacterioplankton; marine carbon cycling; marine microbial biodiversity; marine phytoplankton; microbiology.


Conflict of interest statement

The authors declare that no competing interests exist.

Figures

Figure 1.
Figure 1.. Location of Helgoland Island (ca. 40 km offshore the northern German coastline) and the long-term ecological research site 'Kabeltonne' (red circle: 54° 11.3' N, 7° 54.0' E) in the German Bight of the North Sea.
DOI: http://dx.doi.org/10.7554/eLife.11888.003
Figure 2.
Figure 2.. Satellite chlorophyll a measurements.
Data are shown for the southern North Sea for the months February to May (monthly averages) of the years 2009 to 2012. Images were retrieved from the GlobColour website using the ‘extended Europe area’ at full resolution (1 km) as merged products of weighted averages from the following sensors: MERIS, MODIS AQUA, SeaWIFS and VIIRS. See GlobColour website for details (http://hermes.acri.fr). The position of Helgoland Island is indicated by a blue dot. DOI: http://dx.doi.org/10.7554/eLife.11888.004
Figure 3.
Figure 3.. Physicochemical parameters, phytoplankton composition and bacterioplankton composition as assessed by CARD-FISH.
Sampling: Surface seawater samples were taken at the North Sea island Helgoland between the main island and the minor island 'Düne' (station 'Kabeltonne', 54°11'03''N, 7°54'00''E) using small research vessels (http://www.awi.de/en/expedition/ships/more-ships.html) and processed in the laboratory of the Biological Station Helgoland within less than two hours after sampling. Cells for microscopic visualization methods were first fixed by the addition of formaldehyde to sampled seawater, which was then filtered directly onto 0.2 μm pore sized filters. Physicochemical and phytoplankton data: Physicochemical parameters and phytoplankton data were assessed in subsurface water on a weekday basis as part of the Helgoland Roads LTER time series as described in Teeling et al. (2012). The Helgoland Roads time series is accessible via the public database Pangaea (http://www.pangaea.de) and can be used to assess long-term changes of the North Sea pelagic ecosystem. Left-hand side legends correspond to ordinates on the left, and right-hand side legends to ordinates on the right. A-D: Physicochemical measurements including measurements of BBE Chl a (chlorophyll a fluorescence by algal group analyzer sensor). Left ordinate: salinity [PSU], silicate [μM], nitrate [μM], ammonium [μM] and chlorophyll a [mg/m3]; right ordinate: temperature [°C] and phosphate [μM]. E-H: Counts of the diatom groups. I-L: Microscopic cell counts of the most abundant algae genera (red: diatoms; orange: dinoflagellates: green: haptophytes; blue: silicoflagellates). Algae with large cells and thus large biovolumes are depicted by bold solid lines and algae with small cells are represented by dotted lines. Rhizosolenia styliformis and Mediopyxis helysia feature large cells, whereas Chaetoceros minimus and in particular Phaeocystis species feature small cells. The latter typically reaches lengths of below 10 μm and Phaeocystis spp. biovolumes therefore typically are hundreds to thousands fold smaller than those of R. styliformis and M. helyisa cells (Olenina, 2006; Loebl et al., 2013). Physicochemical data are summarized in Supplementary file 1, and data on the major phytoplankton clades in Supplementary file 2. Total cell counts and CARD-FISH of bacterioplankton: E-H: TCC (total cell counts); red triangles depict sampling of metagenomes. M-β: Recurrent bacterioplankton clades as assessed by CARD-FISH (Catalyzed Reporter Deposition-Fluorescence in situ Hybridization) with the following probes: M-P (major bacterial groups): SAR11-486 and SAR11-441: alphaproteobacterial SAR11-clade; ROS537: alphaproteobacterial Roseobacter clade; GAM42a: Gammaproteobacteria; CF319a: Bacteroidetes. Q-T (major Flavobacteriia clades): POL740: genus Polaribacter; FORM181A: genus Formosa; ULV995: genus Ulvibacter; VIS6-814: genus-level clade VIS6 within the family Cryomorphaceae-Owenweeksia; U-X (major Gammaproteobacteria clades): REI731: genus Reinekea; BAL731: genus Balneatrix; ALT1413: families Alteromonadaceae and Colwelliaceae; SAR92-627: genus-level clade SAR92. Y-β (minor Bacteroidetes clades): FORM181B: species-specific for Formosa sp. Hel1_33_131; NS3a-840: NS3 marine group; NS5/VIS1-575: VIS1 genus-level clade within the NS5 marine group; NS9-664: NS9 marine group; CYT-734: Cytophagia clade Marinoscillum. Total and CARD-FISH cell counts are summarized in Supplementary file 3 and the corresponding probes in Supplementary file 4. DOI: http://dx.doi.org/10.7554/eLife.11888.005
Figure 4.
Figure 4.. Bacterioplankton diversity as assessed by 16S rRNA gene tag sequencing.
Sampling: Surface seawater samples were taken at the North Sea island Helgoland between the main island and the minor island 'Düne' (station 'Kabeltonne', 54°11'03''N, 7°54'00''E) using small research vessels (http://www.awi.de/en/expedition/ships/more-ships.html) and processed in the laboratory of the Biological Station Helgoland within less than two hours after sampling. Biomass of free-living bacteria for DNA extraction was harvested on 0.2 μm pore sized filters after pre-filtration with 10 μm and 3 μm pore sized filters to remove large debris and particle-associated bacteria. Biomass of the 0.2–3 μm bacterioplankton fraction was used for DNA extraction and subsequent 16S rRNA gene tag sequencing. 16S rRNA gene tag sequencing: A total of 142 samples were collected for the years 2010 to 2012. After DNA extraction, the V4 region of the 16S rRNA gene was amplified using the primers 515F (5' GTGCCAGCMGCCGCGGTAA 3') and 806R (5' GGACTACHVGGGTWTCTAAT 3') (Caporaso et al., 2011). Sequencing was carried out on an Illumina (San Diego, CA, USA) MiSeq sequencer with and 2x250 bp chemistry. This dataset was complemented by 16S rRNA gene tags from 7 samples from our initial study on the 2009 spring bloom (Teeling et al., 2012). DNA of these samples was amplified using the primers 314F (5’ CCTACGGGNGGCWGCAG 3') and 805R (5’ GACTACHVGGGTATCTAATCC 3') (Herlemann et al., 2011) and sequenced on the 454 FLX Ti platform. Data analysis: All tag data were analyzed using the SILVAngs pipeline with the SILVA (Quast et al., 2013) v119 database. The SAR92 clade was subsequently reclassified to comply with the recently released SILVA v123, where the SAR92 no longer belong to the order Alteromonadales. The corresponding abundance data is summarized in Supplementary file 5. Time points from days 50 to 160 were plotted for all years. Panel A-P depict data that are analogous to the CARD-FISH data presented in Figure 3, with addition of the Flavobacteriia genus Tenacibaculum (E-H). Panels Q-X show minor Gammaproteobacteria clades (Q-T) and Roseobacter clades together with miscellaneous other minor clades (U-X) that were not tested by CARD-FISH probes. DOI: http://dx.doi.org/10.7554/eLife.11888.006
Figure 5.
Figure 5.. Taxonomic classification of bacterioplankton metagenomes
Sampling: Surface seawater samples were taken at the North Sea island Helgoland between the main island and the minor island 'Düne' (station 'Kabeltonne', 54°11.03' N, 7°54.00' E) and processed in the laboratory of the Biological Station Helgoland within less than two hours after sampling. Biomass of free-living bacteria was harvested on 0.2 μm pore sized filters after pre-filtration with 10 μm and 3 μm pore sized filters to remove large debris and particle-associated bacteria. Sequencing: Community DNA was extracted and sequenced; 2009 samples were sequenced on the 454 FLX Ti platform, and 2010-2012 samples on the Illumina HiSeq2000 platform (16 metagenomes in total). Reads were assembled using Newbler (2009) or a combination of SOAPdenovo and Newbler (2010-2012) and the resulting contigs were taxonomically classified (Supplementary file 9). Visualization: The resulting metagenome contigs are visualized as bubbles with radii that are proportional to their lengths and colors that indicate their predicted taxomomic affiliations. These bubbles are drawn in planes that are defined by the contig's GC contents and coverage values. Colors are restricted to selected abundant taxa (see legend below) to highlight distinct clusters, mostly from the Bacteroidetes, Alphaproteobacteria, Betaproteobacteria and Gammaproteobacteria. Likewise only contigs are shown that exceed a minimum length of 2750 bp for pyrosequencing data (2009) and 15,000 bp for llumina data (2010-2012), respectively. Sparse contigs with very high coverage or GC contents below 20% or above 60% were also excluded from visualizations. The 16 metagenomes are shown arranged in order on yearly timescales that depict chlorophyll a contents as proxies for phytoplankton abundance. Metagenome sizes*: 2009年02月11日: 49.1 Mbp / 2009年03月31日: 44.9 Mbp / 2009年04月07日: 52.7 Mbp / 2009年04月14日: 96.0 Mbp / 2009年06月16日: 29.8 Mbp / 2009年09月01日: 79.2 Mbp 2010年03月03日: 537.3 Mbp / 2010年04月08日: 325.8 Mbp / 2010年05月04日: 453.0 Mbp / 2010年05月18日: 512.3 Mbp 2011年03月24日: 629.1 Mbp / 2011年04月28日: 541.8 Mbp / 2011年05月26日: 604.0 Mbp 2012年03月08日: 574.0 Mbp / 2012年04月16日: 543.9 Mbp / 2012年05月10日: 614.1 Mbp *sums of assembled bases DOI: http://dx.doi.org/10.7554/eLife.11888.007
Figure 6.
Figure 6.. Metagenome functional analyses: CAZyme, sulfatase and transporter gene frequencies.
Sampling: Surface seawater samples were taken at the North Sea island Helgoland between the main island and the minor island Düne' (station 'Kabeltonne', 54°11'03''N, 7°54'00''E) and processed in the laboratory of the Biological Station Helgoland within less than two hours after sampling. Biomass of free-living bacteria was harvested on 0.2 μm pore sized filters after pre-filtration with 10 μm and 3 μm pore sized filters to remove large debris and particle-associated bacteria. Sequencing: Community DNA was extracted and sequenced. 2009 samples were sequenced on the 454 FLX Ti platform, and 2010–2012 samples on the Illumina HiSeq2000 platform (16 metagenomes in total). Reads were assembled using Newbler (2009) or a combination of SOAPdenovo and Newbler (2010–2012) and the resulting contigs were taxonomically classified (Supplementary file 9). Metagenome sizes*: 2009年02月11日: 49.1 Mbp / 2009年03月31日: 44.9 Mbp / 2009年04月07日: 52.7 Mbp / 2009年04月14日: 96.0 Mbp / 2009年06月16日: 29.8 Mbp / 2009年09月01日: 79.2 Mbp 2010年03月03日: 537.3 Mbp / 2010年04月08日: 325.8 Mbp / 2010年05月04日: 453.0 Mbp / 2010年05月18日: 512.3 Mbp 2011年03月24日: 629.1 Mbp / 2011年04月28日: 541.8 Mbp / 2011年05月26日: 604.0 Mbp 2012年03月08日: 574.0 Mbp / 2012年04月16日: 543.9 Mbp / 2012年05月10日: 614.1 Mbp *sums of assembled bases Data Analysis: CAZymes were predicted as consensus of searches against the CAZy, dbCAN and Pfam databases with custom E-value cutoffs (Supplementary file 11). Sulfatase and transporter genes were predicted based on HMMER searches against the Pfam databases with an E-value cutoff of E-5. Gene frequencies were computed as [(sum of average coverage of target genes) *100 / (sum of average coverage of all genes)]. All dates in the graphs are in the format [yyyy-mm-dd]. DOI: http://dx.doi.org/10.7554/eLife.11888.008
Figure 6—figure supplement 1.
Figure 6—figure supplement 1.. CAZyme repertoire within the family Cryomorphaceae (Flavobacteriia) at dates with high Cryomorphaceae abundances.
GH and CBM frequencies were low compared to those of other abundant Flavobacteriia clades (see Figure 6Q,S,T,U), indicating that these Cryomorphaceae might have a distinct ecophysiological niche in which polysaccharide degradation plays a lesser role. DOI: http://dx.doi.org/10.7554/eLife.11888.009
Figure 6—figure supplement 2.
Figure 6—figure supplement 2.. CAZyme repertoire within the order Alteromonadales (Gammaproteobacteria) at dates with high abundances of Alteromonadales.
As expected at the taxomomic level of order, the CAZyme repertoire was diverse. Nonetheless, the obtained pattern was relatively consistent across all four studied years and at some dates notably enriched in CAZymes that play a role during phytoplankton blooms such as GH13 and GH16 DOI: http://dx.doi.org/10.7554/eLife.11888.010

References

    1. Altschul SF, Gish W, Miller W, Myers EW, Lipman DJ. Basic local alignment search tool. Journal of Molecular Biology. 1990;215:403–410. doi: 10.1016/S0022-2836(05)80360-2. - DOI - PubMed
    1. Amin SA, Parker MS, Armbrust EV. Interactions between diatoms and bacteria. Microbiology and Molecular Biology Reviews. 2012;76:667–684. doi: 10.1128/MMBR.00007-12. - DOI - PMC - PubMed
    1. Amin SA, Hmelo LR, van Tol HM, Durham BP, Carlson LT, Heal KR, Morales RL, Berthiaume CT, Parker MS, Djunaedi B, Ingalls AE, Parsek MR, Moran MA, Armbrust EV. Interaction and signalling between a cosmopolitan phytoplankton and associated bacteria. Nature. 2015;522:98–101. doi: 10.1038/nature14488. - DOI - PubMed
    1. Apprill A, McNally S, Parsons R, Weber L. Minor revision to V4 region SSU rRNA 806R gene primer greatly increases detection of SAR11 bacterioplankton. Aquatic Microbial Ecology. 2015;75:129–137. doi: 10.3354/ame01753. - DOI
    1. Armbrust EV. The life of diatoms in the world's oceans. Nature. 2009;459:185–192. doi: 10.1038/nature08057. - DOI - PubMed

Publication types

LinkOut - more resources

Cite

AltStyle によって変換されたページ (->オリジナル) /