This site needs JavaScript to work properly. Please enable it to take advantage of the complete set of features!
Skip to main page content
U.S. flag

An official website of the United States government

Dot gov

The .gov means it’s official.
Federal government websites often end in .gov or .mil. Before sharing sensitive information, make sure you’re on a federal government site.

Https

The site is secure.
The https:// ensures that you are connecting to the official website and that any information you provide is encrypted and transmitted securely.

NIH NLM Logo
Log in
Access keys NCBI Homepage MyNCBI Homepage Main Content Main Navigation
. 2015 Apr 8:9:7.
doi: 10.3389/fninf.2015.00007. eCollection 2015.

Bonsai: an event-based framework for processing and controlling data streams

Affiliations

Bonsai: an event-based framework for processing and controlling data streams

Gonçalo Lopes et al. Front Neuroinform. .

Abstract

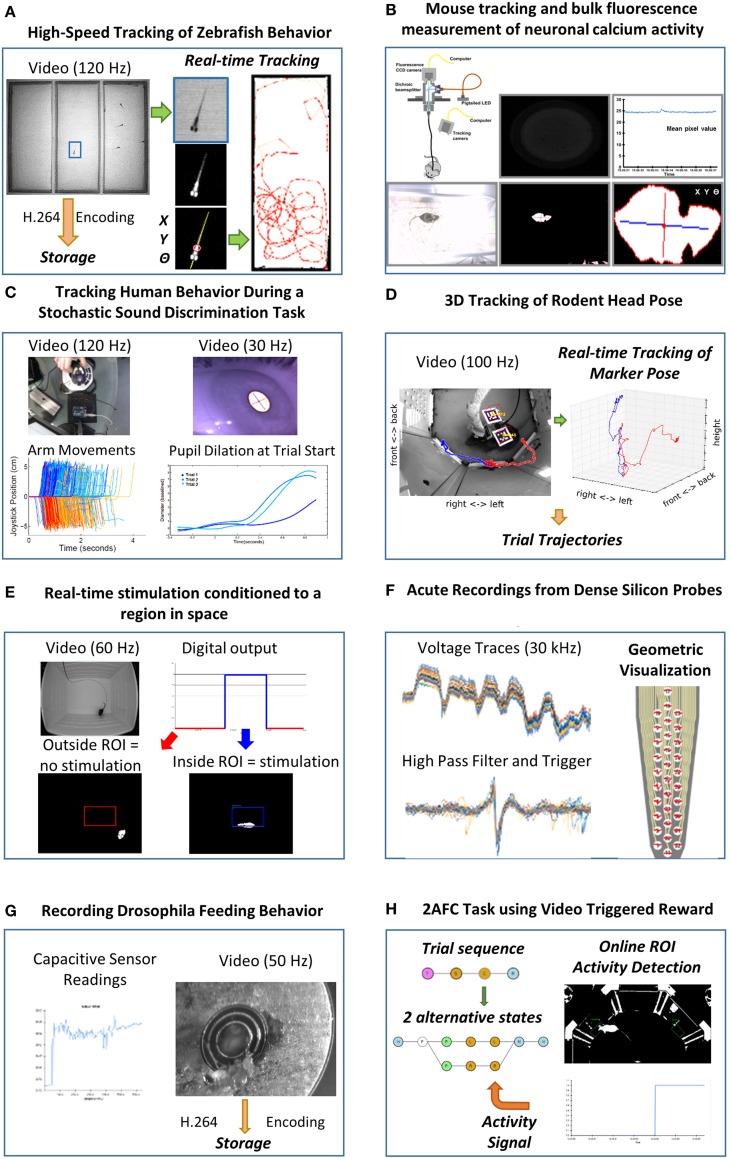
The design of modern scientific experiments requires the control and monitoring of many different data streams. However, the serial execution of programming instructions in a computer makes it a challenge to develop software that can deal with the asynchronous, parallel nature of scientific data. Here we present Bonsai, a modular, high-performance, open-source visual programming framework for the acquisition and online processing of data streams. We describe Bonsai's core principles and architecture and demonstrate how it allows for the rapid and flexible prototyping of integrated experimental designs in neuroscience. We specifically highlight some applications that require the combination of many different hardware and software components, including video tracking of behavior, electrophysiology and closed-loop control of stimulation.

Keywords: behavior control; data acquisition system; data stream processing; electrophysiology; open-source; parallel processing; rapid prototyping; video tracking.


Figures

Figure 1
Figure 1
Screenshot of the Bonsai user interface running a video processing pipeline. An example dataflow for color segmentation and tracking of a moving pendulum is shown. Data sources are colored in violet; transform operators in white; sinks in dark gray. The currently selected node (Hsv Threshold) is colored in black and its configuration parameters are displayed in the properties panel on the right. Overlaid windows and graphs represent Bonsai data visualizers for the output of individual nodes.
Figure 2
Figure 2
Examples of dataflow processing pipelines using Bonsai. (A) Taking grayscale snapshots from a camera whenever a key is pressed. Top: graphical representation of the Bonsai dataflow for camera and keyboard processing. Data sources are colored in violet; transform operators in white; combinators in light blue; sinks in dark gray. Bottom: marble diagram showing an example execution of the dataflow. Colored tokens represent frames arriving from the camera. Black circles represent key press events from the keyboard. Asterisks indicate saving of images to permanent storage. (B) Dynamic modulation of an image processing threshold using the mouse. The x-coordinate of mouse movements is used to directly set the externalized Threshold Value property (orange). The updated threshold value will be used to process any new incoming images. (C) Grouping a set of complex transformations into a single node. In the nested dataflow, the source represents incoming connections to the group and the sink represents the group output.
Figure 3
Figure 3
Using slicing and window processing combinators in Bonsai. (A) Creating data windows using element count information. The Count and Skip parameters specify the size of each window and the number of elements to skip before creating a new window, respectively. Top: graphical representation of the Bonsai dataflow used for slicing. Bottom: marble diagram showing the behavior of the operator for different values of the parameters. The boundaries of each window are indicated by the enclosing rectangles. (B) Creating data windows using timing information. Time is split into intervals of equal fixed duration. Each interval defines a window and data elements are assigned to each window based on the interval that is active at the time of their arrival. Top: Bonsai dataflow. Bottom: marble diagram. (C) Creating data windows using an external trigger. The boundaries of the created windows are defined by the timing of events produced by the trigger source. Top: Bonsai dataflow. Bottom: marble diagram. (D) Moving average of a signal source using windows. Sliding windows of the data are created based on element count information. Top: Bonsai dataflow. The dataflow encapsulated in SelectMany specifies the processing done on each window. In this case, the average value of each window sequence is computed. Middle: marble diagram. As soon as each window is completed, its average value is merged into the result sequence. Bottom: example signal trace before and after the filtering. (E) Online splitting of video recordings into different files based on an external trigger. Top: Bonsai dataflow. Notice that the VideoWriter sink is included inside the SelectMany combinator. Bottom: marble diagram. At the start of each window, a new movie file is created. Asterisks indicate the encoding of individual frames in each window to the corresponding file. (F) Implementing state-machines using window operators. Top: state-machine schematic of a task designed to measure response times. In the Ready state, the stimulus is off. When entering the Go state, the stimulus is turned on. At the end of each trial, the system goes back to the initial state. Bottom: graphical representation of the equivalent Bonsai dataflow. The SelectMany combinator is used to specify the behavior and transitions of each state. The Take combinator truncates a sequence to include only a specified number of initial elements. In this case, only the first element is included. The Repeat combinator restarts a sequence when no more elements are produced (see text).
Figure 4
Figure 4
Example use cases of neuroscience experimental setups using Bonsai. (A) High-speed tracking of zebrafish behavior. Insets depict the image processing steps for segmenting the shape of a fish from the background and extracting its spatial location and orientation. Right: example trajectories extracted from an individual fish. (B) Mouse tracking and bulk fluorescence measurement of neuronal calcium activity. Top insets: schematic of the fiber optic imaging setup for freely moving rodents with example fluorescence data frame and extracted fluorescence signal traces. Bottom insets: image processing steps for behavior tracking of a mouse as the largest dark object in the video. (C) Tracking human behavior during a stochastic sound discrimination task. Left insets: arm movements on the joystick on each trial tracked by brightness segmentation of a bright LED. Right insets: extraction of pupil dilation by computing the length of the major axis of the largest dark object. (D) 3D tracking of rodent head pose. Left inset: example video frame of a mouse carrying fiducial markers. A cube was rendered and superimposed on the image to demonstrate correct registration. Colored traces show representative single trial trajectories of an individual marker, aligned on center poke onset. Red and blue refer to left and right choice trials, respectively. Right inset: Three-dimensional plot of the same trajectories using isometric projection. (E) Real-time stimulation conditioned to a region in space. Top insets: example raw movie frame and stimulation state. Red and blue indicate no stimulation and stimulation regimes, respectively. Bottom insets: example video frames where the mouse is either outside or inside the region of interest. (F) Acute recordings from dense silicon probes. Left insets: example traces from raw amplified voltage signals and high-pass filtered spike triggered waveforms. Right inset: visualization of spike waveforms triggered on a single channel superimposed on the actual probe geometry. (G) Recording Drosophila feeding behavior. Left inset: example trace of a single-channel capacitive signal from the flyPAD. Right inset: simultaneously recorded video of the fly feeding behavior. (H) 2AFC task using video triggered reward. Left inset: schematic of the reactive state machine used for controlling the task. Each state is represented by a nested dataflow. Branches represent possible transitions. Right inset: example thresholded activity from a single region of interest activated by the mouse.
Figure 5
Figure 5
Describing the behavior of dynamic environments using either state-machines or dataflows. (A) A state-machine model of the 1-site foraging task. Zero indicates non-availability of reward at the site. One indicates reward is now available at the site. Labels on edges indicate event transitions. (B) A non-exhaustive state-machine model for a foraging task with two sites. The active state is now a combination of the state of the two sites (indicated by a two character label) and all possible state combinations are tiled across the model. Event labels are omitted for clarity. Notation is otherwise kept. (C) A dataflow model of the 1-site foraging task. Events in the state-machine model are now modeled as data sources. The coincidence detector node propagates a signal only when the sample event closely follows reward availability. (D) A dataflow model for a foraging task with two sites. The number subscripts denote foraging site index.

References

    1. Bainomugisha E., Carreton A. L., Cutsem T., Van Mostinckx S., De Meuter W. (2013). A survey on reactive programming. ACM Comput. Surv. 45, 52:1–52:34 10.1145/2501654.2501666 - DOI
    1. Banzi M., Cuartielles D., Igoe T., Martino G., Mellis D. (2014). Arduino. Available online at: http://www.arduino.cc/
    1. Cook S., Jones G., Kent S., Wills A. C. (2007). Domain Specific Development with Visual Studio DSL Tools. Boston, MA: Addison-Wesley Professional.
    1. Elliott C., Vijayakumar V., Zink W., Hansen R. (2007). National instruments LabVIEW: a programming environment for laboratory automation and measurement. J. Lab. Autom. 12, 17–24 10.1016/j.jala.2006年07月01日2 - DOI
    1. Garrido-Jurado S., Munõz-Salinas R., Madrid-Cuevas F. J., Marín-Jiménez M. J. (2014). Automatic generation and detection of highly reliable fiducial markers under occlusion. Pattern Recognit. 47, 2280–2292 10.1016/j.patcog.201401005 - DOI
Cite

AltStyle によって変換されたページ (->オリジナル) /