This site needs JavaScript to work properly. Please enable it to take advantage of the complete set of features!
Skip to main page content
U.S. flag

An official website of the United States government

Dot gov

The .gov means it’s official.
Federal government websites often end in .gov or .mil. Before sharing sensitive information, make sure you’re on a federal government site.

Https

The site is secure.
The https:// ensures that you are connecting to the official website and that any information you provide is encrypted and transmitted securely.

NIH NLM Logo
Log in
Access keys NCBI Homepage MyNCBI Homepage Main Content Main Navigation
. 2012 Nov 8;76(3):616-28.
doi: 10.1016/j.neuron.2012年08月03日0.

Neural mechanisms of speed-accuracy tradeoff

Affiliations

Neural mechanisms of speed-accuracy tradeoff

Richard P Heitz et al. Neuron. .

Abstract

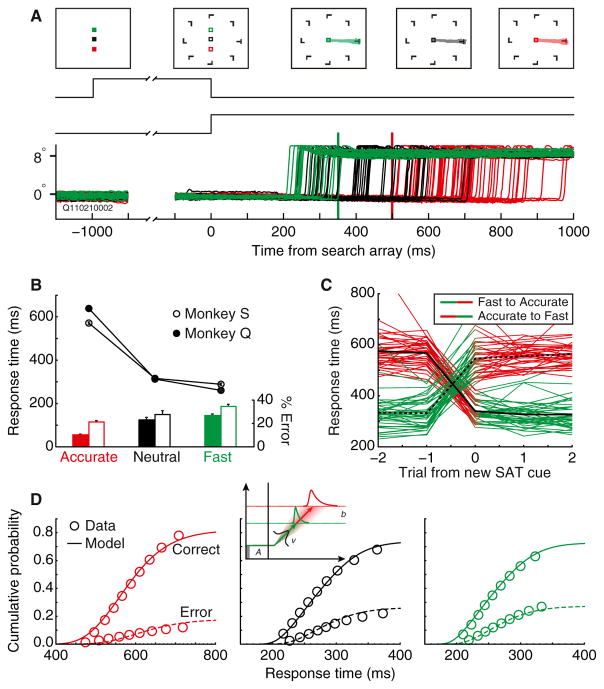
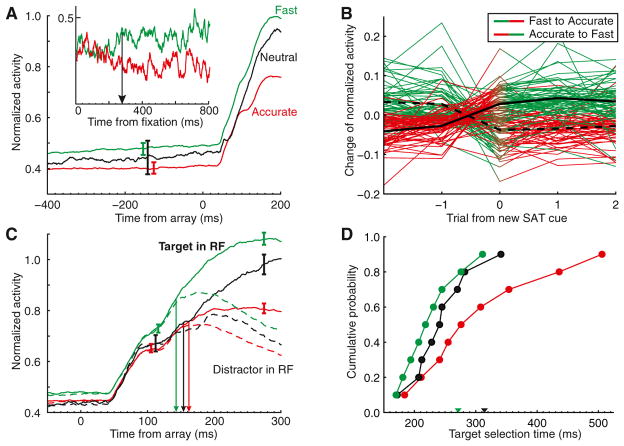
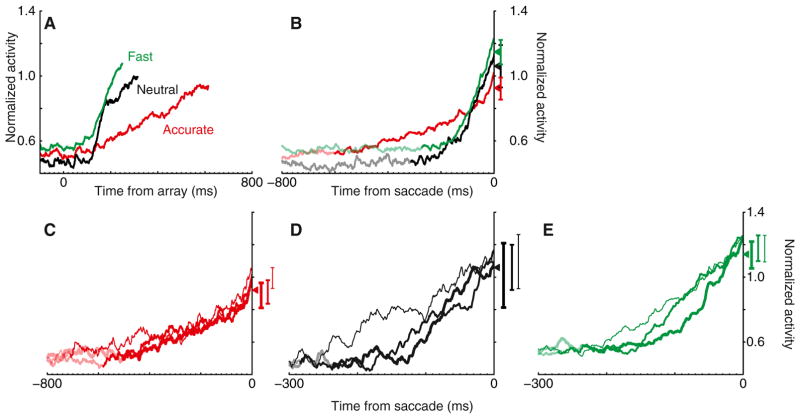
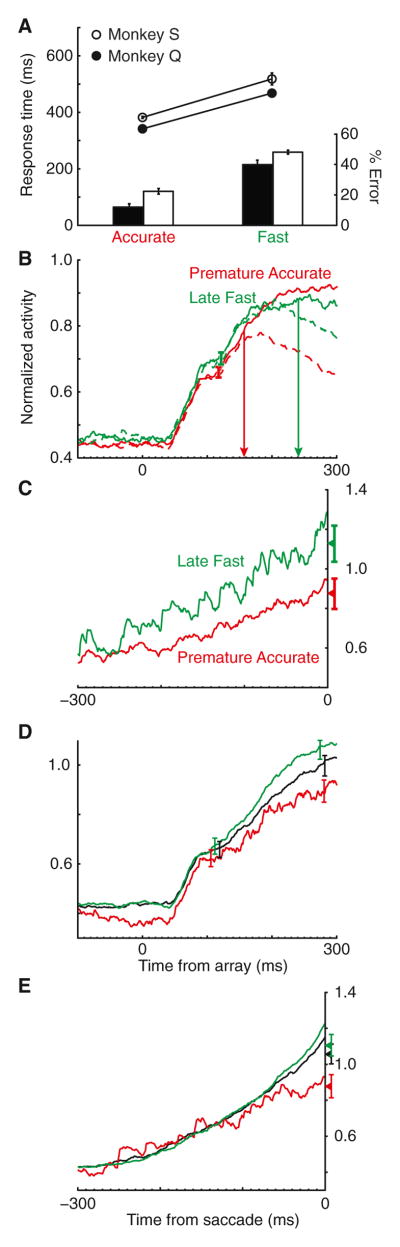
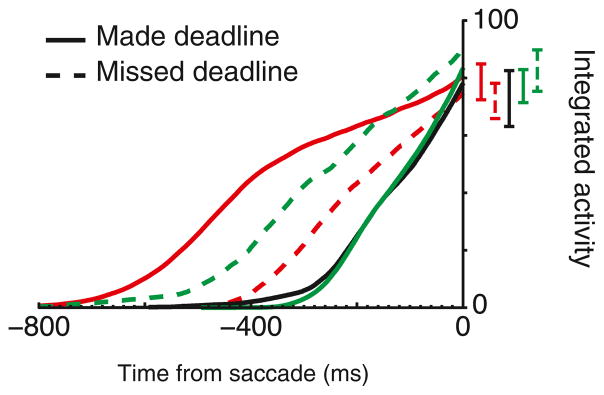
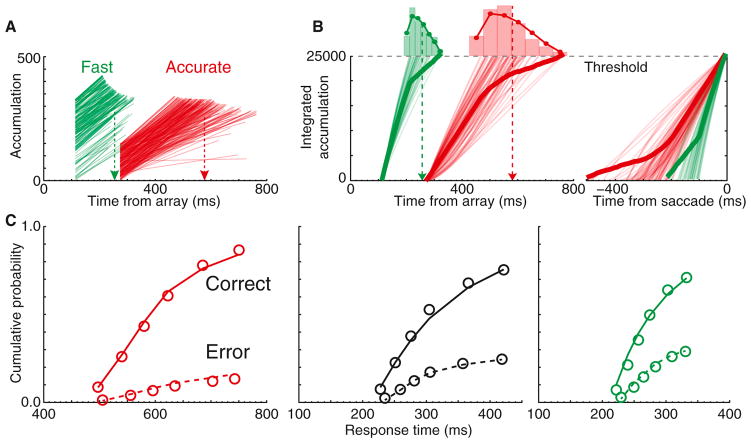
Intelligent agents balance speed of responding with accuracy of deciding. Stochastic accumulator models commonly explain this speed-accuracy tradeoff by strategic adjustment of response threshold. Several laboratories identify specific neurons in prefrontal and parietal cortex with this accumulation process, yet no neurophysiological correlates of speed-accuracy tradeoff have been described. We trained macaque monkeys to trade speed for accuracy on cue during visual search and recorded the activity of neurons in the frontal eye field. Unpredicted by any model, we discovered that speed-accuracy tradeoff is accomplished through several distinct adjustments. Visually responsive neurons modulated baseline firing rate, sensory gain, and the duration of perceptual processing. Movement neurons triggered responses with activity modulated in a direction opposite of model predictions. Thus, current stochastic accumulator models provide an incomplete description of the neural processes accomplishing speed-accuracy tradeoffs. The diversity of neural mechanisms was reconciled with the accumulator framework through an integrated accumulator model constrained by requirements of the motor system.


Figures

Figure 1
Figure 1. Speed-Accuracy Manipulation of Visual Search Performance
(A) Trials began with a fixation cue signifying whether the trial was to be Fast (green), Accurate (red), or Neutral (black). Monkeys searched for a target item (rotated T or L) presented with seven distractors (rotated L or T). In some sessions, distractors were of homogeneous orientation; in other sessions, they were randomly rotated. Eye position plotted for correct trials in a session illustrates the effect of the cue on RT. Vertical lines indicate response deadlines for Fast (green) and Accurate (red) conditions for this session. (B) Mean RT and accuracy rate across all sessions for each monkey. RT decreased and error rate increased with speed stress in both monkeys (monkey Q RT: t24 = −19.4, accuracy: t24 = −11.1; monkey S RT: t14 = −13.7, accuracy: t14 = −5.6, all p < 0.001, linear regression). Vertical bars show ±1 SE. (C) Mean RT on trials before and after change of SAT cue. Data from all sessions are plotted with each session contributing two lines, one for Fast to Accurate (green to red) switches and one for Accurate to Fast (red to green). RT increased immediately and significantly between Fast and Accurate blocks (two-tailed t39 = −20.3, p < 0.001) and decreased between Accurate and Fast blocks (t39 = 30.3, p < 0.001). Data from the Neutral condition are not displayed. (D) Accumulator model fits for Accurate (left), Neutral (middle), and Fast (right) conditions. Observed (circles) and predicted (lines) defective cumulative probability of correct (solid) and error (dashed) RTs for all trials sampled are shown. Only threshold varied across conditions; other parameters were shared (inset).
Figure 2
Figure 2. Adjustment of Salience Processing with SAT
(A) Average normalized activity for visual salience neurons with significantly different baseline activity in Fast versus Accurate conditions. All trials were included irrespective of upcoming target location or response. The discharge rate in the 300 ms before array presentation was significantly greater in the Fast than in the Accurate condition (t64 = 11.1, p < 0.001, linear regression). Vertical bars represent ±1 SE at the interval of statistical analysis. Inset shows evolution of proactive modulation after a SAT cue change; the arrow marks when the activity first signaled a change between Fast and Accurate conditions. (B) Adjustment of baseline activity after change of SAT cue. Difference on the trials before, during, and after a SAT cue change of normalized baseline activity relative to overall average is shown. An immediate change with the presentation of a new SAT cue occurred for transitions from Accurate to Fast (two-tailed t64 = −10.1, p < 0.001) and from Fast to Accurate (t64 = 7.8, p < 0.001). Data from the Neutral condition are not displayed. (C) Adjustment of salience processing. Average normalized discharge rates for all visual salience neurons when the target (solid) or distractors (dashed) appeared in the RF on correct trials. The baseline adjustment is less apparent because of averaging across neurons with and without the effect. Speed stress increased responsiveness (t144 = 7.9, p < 0.01, 100–125 ms after array; t144 = 9.8, p < 0.001, 250–300 ms after array, linear regression) and decreased target selection time (arrows; Accurate 162 ms > Neutral 154 ms, t145 = 5.1, p < 0.001; Neutral 154 ms > Fast 143 ms, t145 = 77.0, p < 0.001, jackknifed t tests). Vertical bars represent ±1 SE. (D) Cumulative distribution of target selection times for all visual salience neurons. Mean RTs in the Fast, Neutral, and Accurate SAT conditions were, respectively, 271 ms (green arrowhead), 314 ms (black arrowhead), and 614 ms (beyond axis).
Figure 3
Figure 3. Adjustment of Response Preparation with SAT
(A) Average normalized discharge rate of all movement neurons for correct trials when the target fell in the neuron’s movement field, aligned on array presentation. Plots are truncated at mean RT. Note that the baseline adjustment reported in text is obscured by averaging across neurons with and without the effect. (B) Average normalized discharge rate of all movement neurons for correct trials when the target fell in the neuron’s movement field, aligned on saccade initiation. Activity before mean RT is plotted lighter. On average, the slope of activity in the 100 ms preceding saccade increased with speed stress (Accurate: 2.0 < Neutral: 4.0 < Fast: 4.6 normalized sp/s2; t13 = 3.1, p < 0.01, linear regression). Activity 20–10 ms before saccade significantly increased with speed stress (t13 = 2.2, p < 0.05, linear regression). (C–E) Discharge rates in Accurate (C), Neutral (D), and Fast (E) conditions for correct target-in-RF trials separated into fastest (thick), intermediate (thinner), and longest (thinnest) RT quantiles. Activity 20–10 ms before saccade varied across but not within SAT conditions (all p> 0.05, linear regression). All vertical bars represent ±1 SE.
Figure 4
Figure 4. Experimental Controls for RT across SAT
(A) RT and error rate for missed deadlines (premature Accurate and late Fast responses). Mean RT was necessarily reversed (monkey Q t24 = −5.9, p < 0.001; monkey S t14 = −13.2, p < 0.001, two-tailed t tests), but error rate remained greater in the Fast condition (monkey Q t24 = −7.6, p < 0.001; monkey S t14 = −10.9, p < 0.001, two-tailed t tests). (B) Average normalized activity for all visual salience neurons when the target (solid) or distractors (dashed) appeared in the RF on premature Accurate and late Fast trials (Neutral condition data are not included because there were no deadlines). Despite the reversal of RT, enhanced activity persisted 100–125 ms postarray onset in Fast compared to Accurate trials (t144 = −2.8, p < 0.01, two-tailed t test). Activity in a later period (250–300 ms) was not significantly different (p > 0.05). However, target selection time (vertical arrows) was significantly slower in late Fast (241 ms) than premature Accurate (157 ms) trials (jackknife test t144 = −2,923.2, p < 0.001). (C) Average normalized activity for all movement neurons when the target appeared in the movement field on premature Accurate and late Fast trials. Even with the reversal of RT, movement activity 20–10 ms before saccade remained higher in late Fast than in premature Accurate trials (t13 = −2.0, p = 0.06, two-tailed t test). (D) Average normalized activity for all visual salience neurons when the target appeared in the RF on Accurate, Neutral, and Fast trials equated for RT. RTs were equated by constructing a range of RTs based on ±1 SD of the median RT in the Neutral condition. RTs in Accurate, Neutral, and Fast conditions falling outside of this range were excluded, which resulted in low variability between the conditions (e.g., before correction: 614 [Accurate] – 271 [Fast] = 343 ms; after correction: 315 – 269 = 46 ms). Visual salience activity remained elevated in Fast versus Accurate trials 250–300 ms postarray onset (t45 = 4.8, p < 0.001, linear regression) but not in the interval 100–125 ms postarray onset (t45 = 1.7, p = 0.10, linear regression). (E) Average normalized activity for all movement neurons when the target appeared in the movement field on Accurate, Neutral, and Fast trials equated for RT. Movement activity in the interval 20–10 ms prior to saccade increased with speed stress (t29 = 3.1, p < 0.01, linear regression). Vertical bars in all panels represent ±1 SE drawn at the interval of statistical analysis.
Figure 5
Figure 5. Leaky Integration of Movement Neuron Activity
Average activity of all movement neurons when the target appeared in the RF on correct trials, integrated with a decay constant of 100 ms from array presentation until saccade initiation. Integrated values 20–10 ms before saccade initiation were not significantly different between SAT conditions, even when the RT deadline was missed (all p> 0.05, linear regression). Invariance of integrated values at saccade initiation was observed with time constants of 7–167 ms. Vertical bars represent ±1 SE.
Figure 6
Figure 6. Integrated Accumulator Model
(A) Sample accumulation functions for correct trials from the best-fitting model for Fast and Accurate trials. Starting levels and slopes were highest for Fast, intermediate for Neutral (data not shown), and lowest for Accurate. Arrows denote mean simulated RT. (B) Sample and average integrated accumulation functions aligned on array (left) and response (right). The distribution of finish times to an invariant threshold (histogram) reproduce distribution of RTs (overlaid). (C) iA model predicts probability and times of correct and error responses across Accurate (left), Neutral (middle), and Fast (right) SAT conditions. Observed (circles) and predicted (lines) defective cumulative probability of correct (solid) and error (dashed) RTs are shown.

References

    1. Balan PF, Oristaglio J, Schneider DM, Gottlieb J. Neuronal correlates of the set-size effect in monkey lateral intraparietal area. PLoS Biol. 2008;6:e158. - PMC - PubMed
    1. Basso MA, Wurtz RH. Neuronal activity in substantia nigra pars reticulata during target selection. J Neurosci. 2002;22:1883–1894. - PMC - PubMed
    1. Bogacz R, Brown E, Moehlis J, Holmes P, Cohen JD. The physics of optimal decision making: a formal analysis of models of performance in two-alternative forced-choice tasks. Psychol Rev. 2006;113:700–765. - PubMed
    1. Bogacz R, Wagenmakers EJ, Forstmann BU, Nieuwenhuis S. The neural basis of the speed-accuracy tradeoff. Trends Neurosci. 2010;33:10–16. - PubMed
    1. Boucher L, Palmeri TJ, Logan GD, Schall JD. Inhibitory control in mind and brain: an interactive race model of countermanding saccades. Psychol Rev. 2007;114:376–397. - PubMed

Publication types

LinkOut - more resources

Cite

AltStyle によって変換されたページ (->オリジナル) /