This site needs JavaScript to work properly. Please enable it to take advantage of the complete set of features!
Skip to main page content
U.S. flag

An official website of the United States government

Dot gov

The .gov means it’s official.
Federal government websites often end in .gov or .mil. Before sharing sensitive information, make sure you’re on a federal government site.

Https

The site is secure.
The https:// ensures that you are connecting to the official website and that any information you provide is encrypted and transmitted securely.

NIH NLM Logo
Log in
Access keys NCBI Homepage MyNCBI Homepage Main Content Main Navigation
. 2012 Aug 1:705:280-305.
doi: 10.1017/jfm.2012.220. Epub 2012 Jul 2.

Rarefaction and blood pressure in systemic and pulmonary arteries

Affiliations

Rarefaction and blood pressure in systemic and pulmonary arteries

Mette S Olufsen et al. J Fluid Mech. .

Abstract

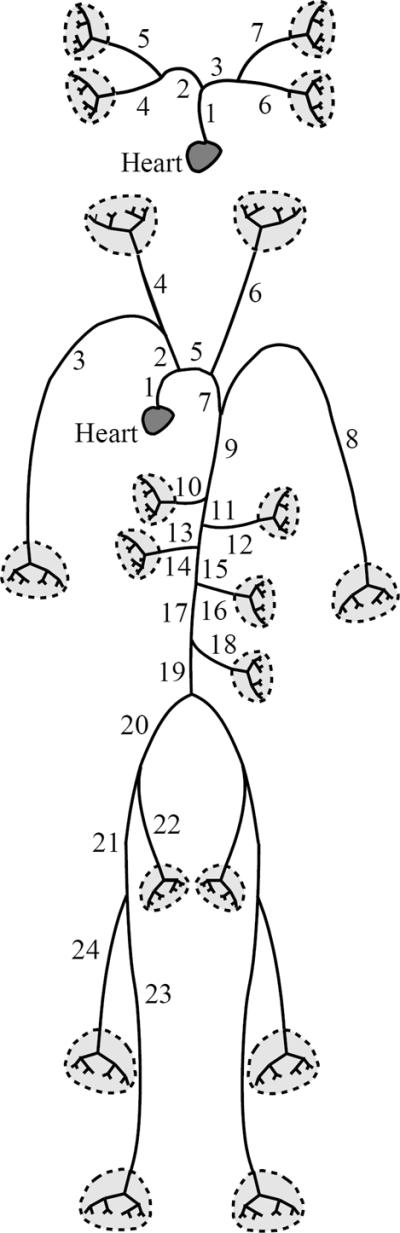
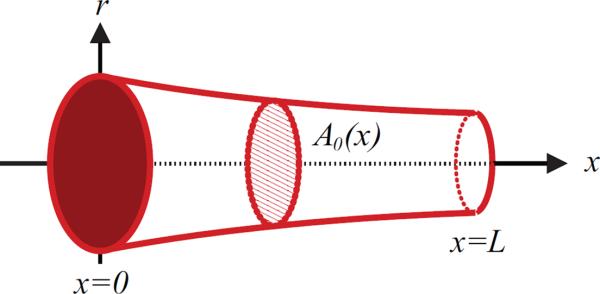
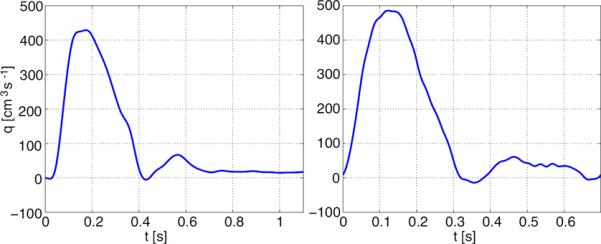
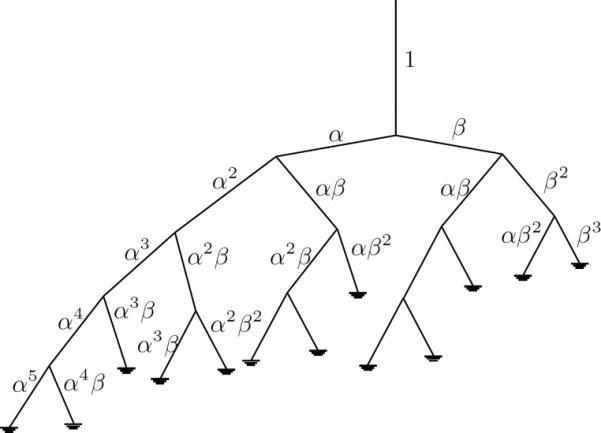
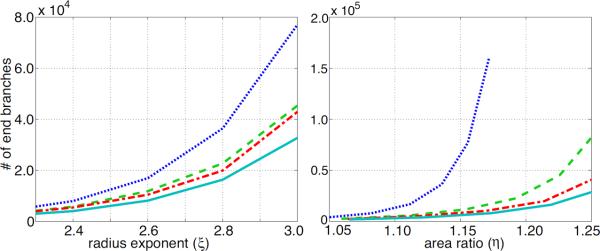
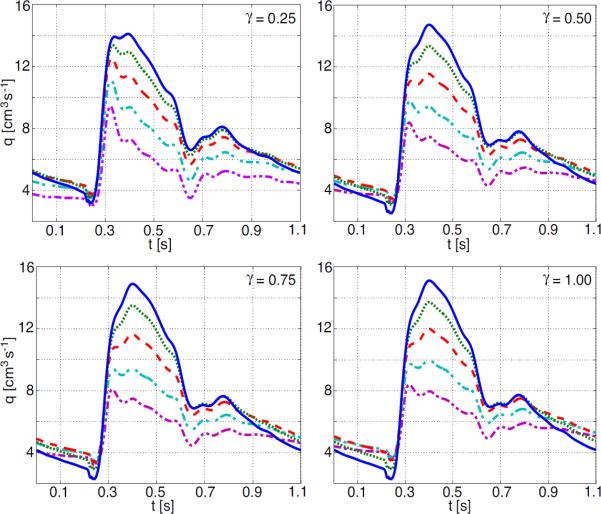
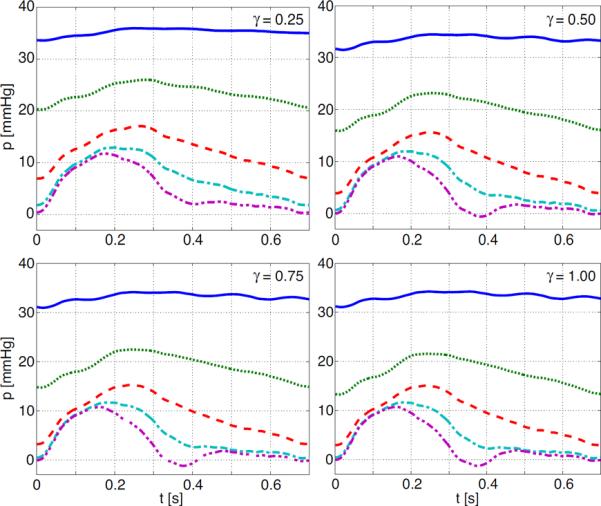
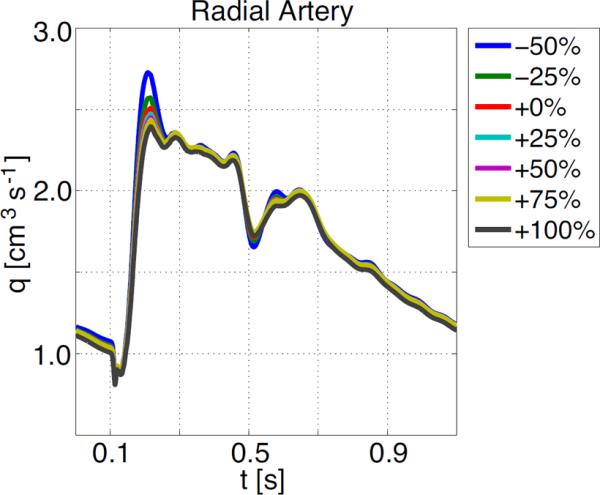
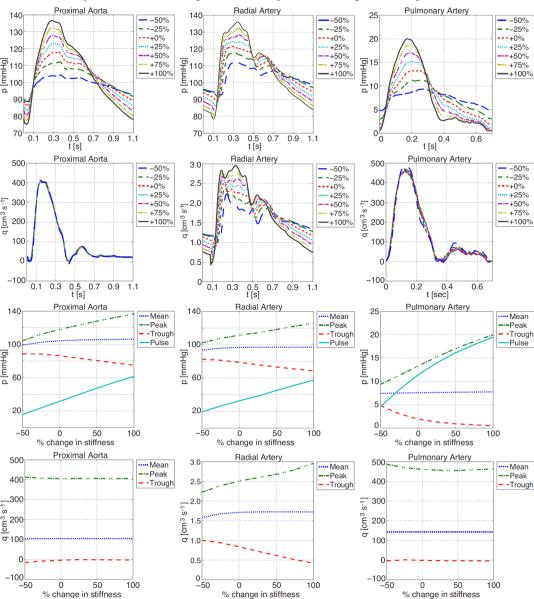
The effects of vascular rarefaction (the loss of small arteries) on the circulation of blood are studied using a multiscale mathematical model that can predict blood flow and pressure in the systemic and pulmonary arteries. We augmented a model originally developed for the systemic arteries (Olufsen et al. 1998, 1999, 2000, 2004) to (a) predict flow and pressure in the pulmonary arteries, and (b) predict pressure propagation along the small arteries in the vascular beds. The systemic and pulmonary arteries are modelled as separate, bifurcating trees of compliant and tapering vessels. Each tree is divided into two parts representing the `large' and `small' arteries. Blood flow and pressure in the large arteries are predicted using a nonlinear cross-sectional area-averaged model for a Newtonian fluid in an elastic tube with inflow obtained from magnetic resonance measurements. Each terminal vessel within the network of the large arteries is coupled to a vascular bed of small `resistance' arteries, which are modelled as asymmetric structured trees with specified area and asymmetry ratios between the parent and daughter arteries. For the systemic circulation, each structured tree represents a specific vascular bed corresponding to major organs and limbs. For the pulmonary circulation, there are four vascular beds supplied by the interlobar arteries. This manuscript presents the first theoretical calculations of the propagation of the pressure and flow waves along systemic and pulmonary large and small arteries. Results for all networks were in agreement with published observations. Two studies were done with this model. First, we showed how rarefaction can be modelled by pruning the tree of arteries in the microvascular system. This was done by modulating parameters used for designing the structured trees. Results showed that rarefaction leads to increased mean and decreased pulse pressure in the large arteries. Second, we investigated the impact of decreasing vessel compliance in both large and small arteries. Results showed, that the effects of decreased compliance in the large arteries far outweigh the effects observed when decreasing the compliance of the small arteries. We further showed that a decrease of compliance in the large arteries results in pressure increases consistent with observations of isolated systolic hypertension, as occurs in ageing.


Figures

Figure 1
Figure 1
Schematic of the large pulmonary (top) and systemic (bottom) arteries used in the mathematical model.
Figure 2
Figure 2
A tapering artery. For the model, the vessel length (L) as well as the diameter at the proximal (at x = 0) and distal (at x = L) ends of the vessel are measured. Using this information, the unstressed vessel area A0(x)=πr02(x) is calculated, where r0(x) is calculated from (2.1).
Figure 3
Figure 3
Inflow profiles for the aorta (left) and main pulmonary artery (right). The data are for two different individuals so that the periods are not the same. The profiles were interpolated from MRI measurements sampled at 32 (aorta) and 45 (pulmonary artery) points per period.
Figure 4
Figure 4
The structured tree of small vessels showing scaling factors.
Figure 5
Figure 5
Log-log plots of the vessel radius (r in mm) versus length (l in mm) for pulmonary arteries, using data from Huang et al. (1996). The two lines are fitted using the method of least squares, and show that different scalings apply for r < 0.05 mm (Strahler orders 1 to 4) and r > 0.05 mm (Strahler orders 4 to 12).
Figure 6
Figure 6
Flow in the systemic (left column) and pulmonary (right column) arteries. The top graphs show inflow to the systemic (left) and pulmonary (right) arteries from two different individuals. The second and third rows show flow along the α- and β-branches in the femoral (left) and pulmonary (right) vascular beds. The bottom graphs show the mean flow in these vascular beds along the α (upper, green dashed) and β (lower, blue) branches.
Figure 7
Figure 7
Pressure in the systemic and pulmonary vascular beds. From top row shows the pressure in the proximal aorta, and then pressures in the femoral vascular bed from two different individuals. The top row shows the pressure in the aorta (left) and pulmonary artery (right). The second and third rows show pressure profiles along the α- and β-branches, respectively. The bottom row shows the mean pressure along the α- (upper, green dashed) and β-branch (lower, blue), together with the average across all vessels in the vascular bed (centre line, red).
Figure 8
Figure 8
Relationship between radius exponent ξ and the area ratio η (left), as well as effects of rarefaction on the total number of vessels in the structured tree as a function of the radius exponent (centre), and the area ratio (right). The graphs are for four values of γ = {0.25, 0.5, 0.75, 1.0} shown as dotted, dashed, dash-dotted, and solid curves, respectively.
Figure 9
Figure 9
Effects of rarefaction on the number of end vessels in a structured tree. The graphs are for four values of γ = {0.25, 0.5, 0.75, 1.0} coloured blue (dotted), green (dashed), red (dash–dotted), and cyan (solid), respectively.
Figure 10
Figure 10
Effects of rarefaction on flow waveforms in the femoral artery. Lines on each graph correspond to ξ = {2.2, 2.4, 2.6, 2.8, 3.0} indicated by blue (solid), green (dot), red (dash), cyan (dash-dot) and magenta (dash-dot-dot) respectively.
Figure 11
Figure 11
Effects of rarefaction on pressure waveforms in the main pulmonary artery. Lines on each graph correspond to ξ = {2.2, 2.4, 2.6, 2.8, 3.0} indicated by blue (solid), green (dot), red (dash), cyan (dash-dot) and magenta (dash-dot-dot) respectively.
Figure 12
Figure 12
Effects of changing compliance in the small vessels on flow in the radial artery.
Figure 13
Figure 13
Effects of decreasing compliance in the large vessels (decreasing compliance makes the vessels stiffer) on pressure and flow in the proximal aorta, the radial and the main pulmonary arteries.

References

    1. Antonios TF, Singer DRJ, Markandu ND, Mortimer PS, MacGregor GA. Rarefaction of skin capillaries in borderline essential hypertension suggests an early structural abnormality. Hypertension. 1999;34:655–658. - PubMed
    1. Antonios TF, Rattrat FM, Singer DRJ, Markandu ND, Mortimer PS, MacGregor GA. Rarefaction of skin capillaries in normotensive offspring of individuals with essential hypertension. Heart J. 2003;89:175–178. - PMC - PubMed
    1. Antonios TF. Microvascular rarefaction in hypertension — reversal or over-correction by treatment? Am. J. Hyperten. 2006;19:484–485. - PubMed
    1. Atabek HB, Lew HS. Wave propagation through a viscous incompressible fluid contained in an initially stressed elastic tube. Biophys. J. 1966;6:481–503. - PMC - PubMed
    1. Atabek HB. Wave propagation through a viscous fluid contained in a tethered, initially stressed, orthotropic elastic tube. Biophys. J. 1968;8:626–649. - PMC - PubMed

LinkOut - more resources

Cite

AltStyle によって変換されたページ (->オリジナル) /