This site needs JavaScript to work properly. Please enable it to take advantage of the complete set of features!
Skip to main page content
U.S. flag

An official website of the United States government

Dot gov

The .gov means it’s official.
Federal government websites often end in .gov or .mil. Before sharing sensitive information, make sure you’re on a federal government site.

Https

The site is secure.
The https:// ensures that you are connecting to the official website and that any information you provide is encrypted and transmitted securely.

NIH NLM Logo
Log in
Access keys NCBI Homepage MyNCBI Homepage Main Content Main Navigation
. 2012;8(7):e1002580.
doi: 10.1371/journal.pcbi.1002580. Epub 2012 Jul 5.

The generation of phase differences and frequency changes in a network model of inferior olive subthreshold oscillations

Affiliations

The generation of phase differences and frequency changes in a network model of inferior olive subthreshold oscillations

Benjamin Torben-Nielsen et al. PLoS Comput Biol. 2012.

Abstract

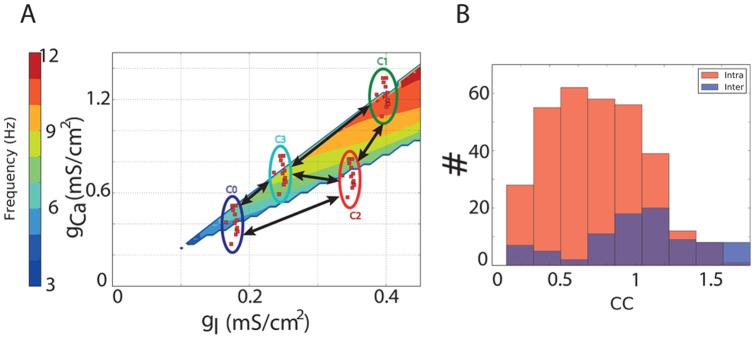
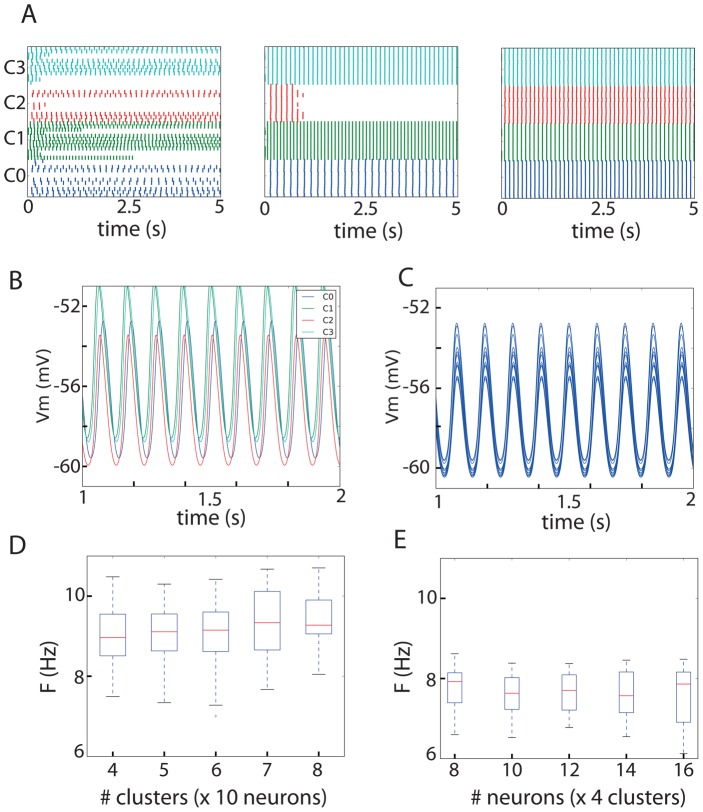
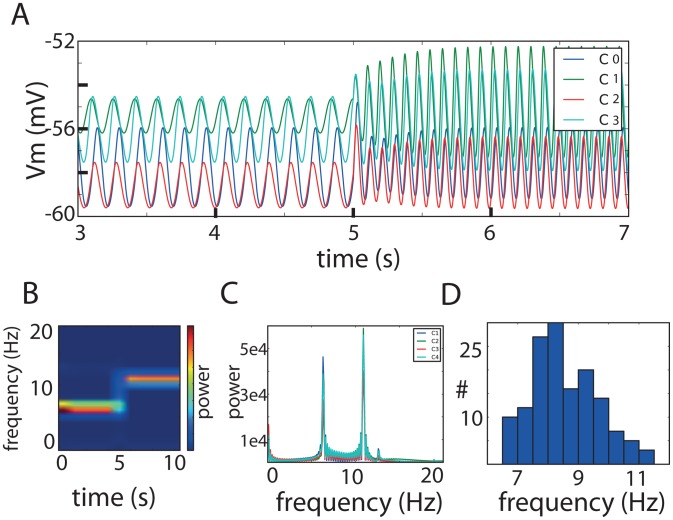
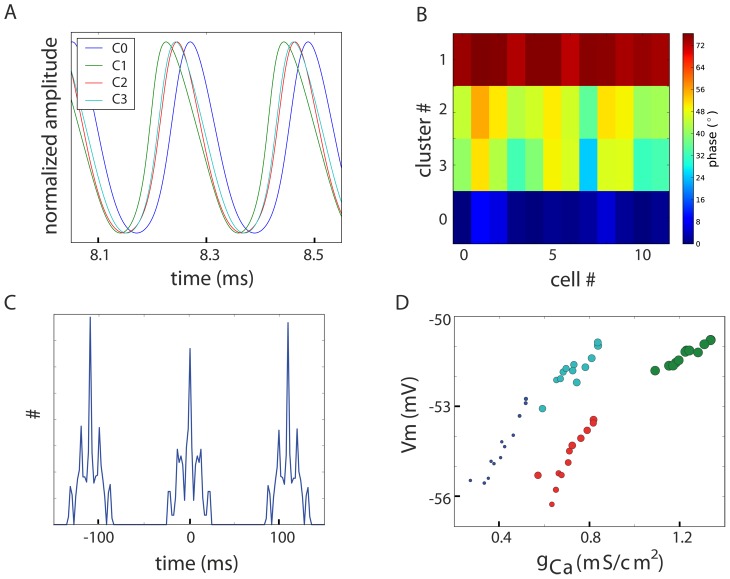
It is commonly accepted that the Inferior Olive (IO) provides a timing signal to the cerebellum. Stable subthreshold oscillations in the IO can facilitate accurate timing by phase-locking spikes to the peaks of the oscillation. Several theoretical models accounting for the synchronized subthreshold oscillations have been proposed, however, two experimental observations remain an enigma. The first is the observation of frequent alterations in the frequency of the oscillations. The second is the observation of constant phase differences between simultaneously recorded neurons. In order to account for these two observations we constructed a canonical network model based on anatomical and physiological data from the IO. The constructed network is characterized by clustering of neurons with similar conductance densities, and by electrical coupling between neurons. Neurons inside a cluster are densely connected with weak strengths, while neurons belonging to different clusters are sparsely connected with stronger connections. We found that this type of network can robustly display stable subthreshold oscillations. The overall frequency of the network changes with the strength of the inter-cluster connections, and phase differences occur between neurons of different clusters. Moreover, the phase differences provide a mechanistic explanation for the experimentally observed propagating waves of activity in the IO. We conclude that the architecture of the network of electrically coupled neurons in combination with modulation of the inter-cluster coupling strengths can account for the experimentally observed frequency changes and the phase differences.


Conflict of interest statement

The authors have declared that no competing interests exist.

Figures

Figure 1
Figure 1. Proposed network architecture.
A: Model neurons only contain leak and Ca2+ currents and spontaneously oscillate at frequencies determined by the exact density of the associated conductances. Colors of the gl-gCa plane indicate the frequency at which a model with the corresponding density of conductances oscillates; in the white region model neurons do not oscillate spontaneously. The network itself consists of individual neurons (red squares) grouped in clusters (colored ellipses; color not related to the frequency). Neurons inside the cluster are connected to 4 neighbors. When two clusters are connected (black arrows) each neuron from one cluster is connected to a random neuron in the other cluster. All connections are gap-junctions. B: Resulting coupling coefficients of all connections in the network. This specific network is used throughout the manuscript for demonstration purposes.
Figure 2
Figure 2. Stable subthreshold oscillation in a clustered network of the IO.
A: Raster plot containing all neurons in the network; peaks of the oscillation are denoted by a dot. Without connections only 26 out of 48 neurons oscillate (left panel). When the intra-cluster connections are added, 3 out of 4 clusters show synchronized oscillations within the clusters (center panel). After adding the inter-cluster connections as well, the whole network reaches a synchronized oscillation of 9.2 Hz. B: Detail of the membrane potential of one neuron from each cluster indicating that the network can sustain stable subthreshold oscillations. Colors of the membrane trace and the ellipses in panel A are matching. C: Detail of the membrane potential of all neurons in one cluster (C0). D&E: Stable oscillations in the proposed network architecture are robust to changes in the number of clusters and the number of cluster per neuron. In D, networks with a varying number of clusters but a fixed cluster size (10 neurons) and a randomized connectivity scheme were tested. In E, networks with 4 clusters and a varying cluster size were tested (while the connectivity scheme was fixed as in the reference network. Therefore, the "4 clusters×ばつ10 neurons" from panel D and E are not the same). Boxplots indicate the median and the boxes extend from the lower to the upper quartile. It follows that robust synchronized oscillations can be generated by a variety of networks and that each network can achieve a range of frequencies.
Figure 3
Figure 3. Robust modulation of network frequency by changing the inter-cluster coupling strengths.
A: Membrane potential of one neuron per cluster just before and after manually changing the inter-cluster connection strength in the reference network. The change in inter-cluster strength caused a shift in the synchronized oscillation frequency from 6.3 Hz to 10.9 Hz. B: Short-term Fourier transformation of the membrane potential of one neuron in the network indicates the shift in frequency. C: Fourier transformation of the membrane potential of one neuron of each cluster. All clusters oscillate at the same frequency and are subject to the same shift. D: Histogram of frequencies at which the same network with pseudo-random inter-cluster connections strengths can oscillate in synchrony. Only changing the inter-cluster coupling strength (within realistic ranges, i.e., CC<20%) can be sufficient to bring the network to a state of synchronized oscillations with frequencies between 6 and 11 Hz.
Figure 4
Figure 4. Stable phase differences between neurons.
A: Focus on the normalized membrane potential of one neuron per cluster reveals that clusters with higher Ca2+-conductance are advanced in phase with respect to other clusters (traces have colors matching with Figure 1). In the regime of oscillatory IO neurons, higher Ca2+-density indicates a higher resting membrane potential that causes the neuron to lead in the phase. B: Phase-map color coding the phase-difference between all neurons in the network. Phase differences are given in degrees relative to the inter-peak-interval; the phase of the bottom left neuron is taken as reference (0°). Neurons within the same cluster have similar phases due to similar resting potentials, while larger phase-differences arise between clusters that are farther apart in terms of their conductances. The maximum phase-difference between two neurons was 72° in the demonstration network. C: Cross-correlation of the peak times between (one neuron from the) four clusters computed for 5 s traces confirms that the phase-differences are stable over time. D: The amplitude and phase difference is proportional to the amount of gCa-conductance a neuron contains. The y-axis denotes the peak voltage and the x-axis indicates the conductance density. The color-coding is the same as in A while the size represents the phase-difference (as measured between the neuron at the bottom left and any other neuron).

References

    1. Devor A, Yarom Y. Electrotonic Coupling in the Inferior Olivary Nucleus Revealed by Simultaneous Double Patch Recordings. J Neurophysiol. 2002;87:3048–3058. - PubMed
    1. Hoge GJ, Davidson KGV, Yasumura T, Castillo PE, Rash JE, et al. The extent and strength of electrical coupling between inferior olivary neurons is heterogeneous. J Neurophysiol. 2011;105:1089–1101. - PMC - PubMed
    1. Brockmann MD, Pöschel B, Cichon N, Hanganu-Opatz IL. Coupled Oscillations Mediate Directed Interactions between Prefrontal Cortex and Hippocampus of the Neonatal Rat. Neuron. 2011;71:332–347. - PubMed
    1. Roš H, Sachdev RNS, Yu Y, Šestan N, McCormick DA. Neocortical Networks Entrain Neuronal Circuits in Cerebellar Cortex. J Neurosci. 2009;29:10309–10320. - PMC - PubMed
    1. Solinas S, Nieus T, D'Angelo E. A realistic large-scale model of the cerebellum granular layer predicts circuit spatio-temporal filtering properties. Front Cell Neurosci. 2010;4:12. - PMC - PubMed

Publication types

Cite

AltStyle によって変換されたページ (->オリジナル) /