This site needs JavaScript to work properly. Please enable it to take advantage of the complete set of features!
Skip to main page content
U.S. flag

An official website of the United States government

Dot gov

The .gov means it’s official.
Federal government websites often end in .gov or .mil. Before sharing sensitive information, make sure you’re on a federal government site.

Https

The site is secure.
The https:// ensures that you are connecting to the official website and that any information you provide is encrypted and transmitted securely.

NIH NLM Logo
Log in
Access keys NCBI Homepage MyNCBI Homepage Main Content Main Navigation
. 2010 May 14:4:12.
doi: 10.3389/fncel.2010.00012. eCollection 2010.

A realistic large-scale model of the cerebellum granular layer predicts circuit spatio-temporal filtering properties

Affiliations

A realistic large-scale model of the cerebellum granular layer predicts circuit spatio-temporal filtering properties

Sergio Solinas et al. Front Cell Neurosci. .

Abstract

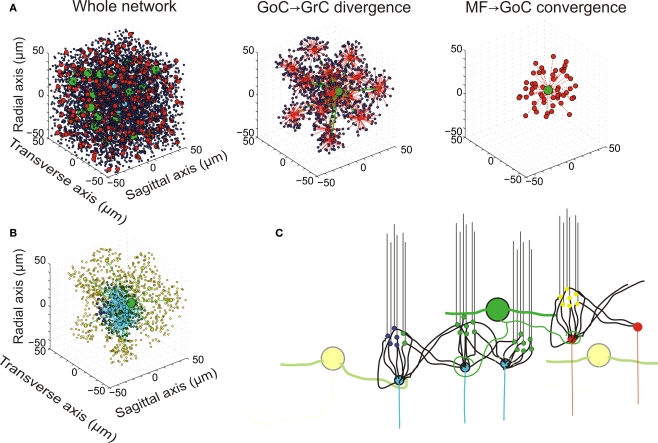
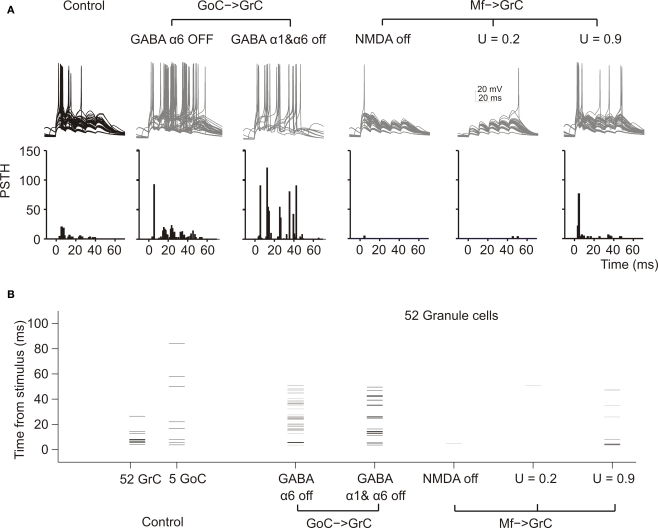
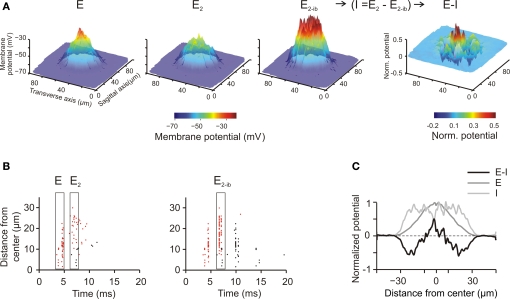
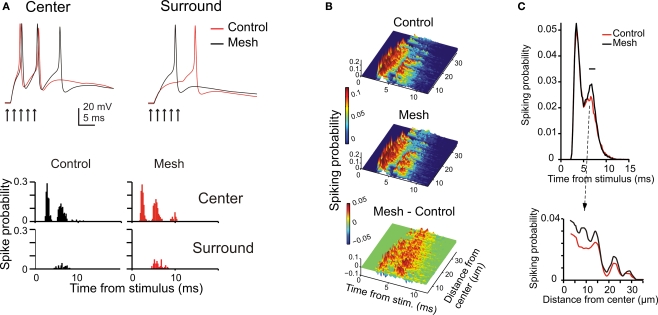
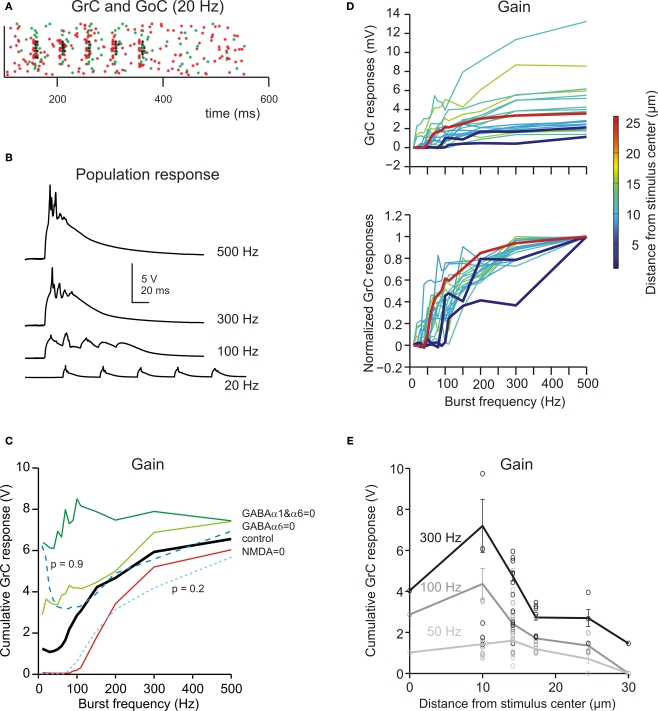
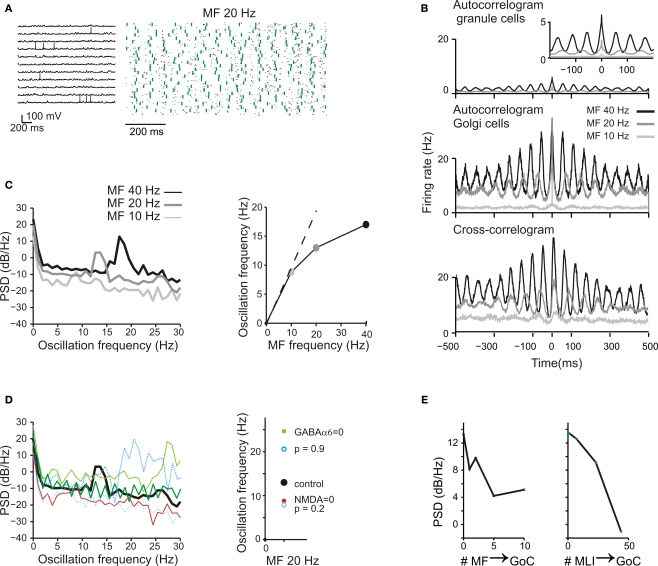
The way the cerebellar granular layer transforms incoming mossy fiber signals into new spike patterns to be related to Purkinje cells is not yet clear. Here, a realistic computational model of the granular layer was developed and used to address four main functional hypotheses: center-surround organization, time-windowing, high-pass filtering in responses to spike bursts and coherent oscillations in response to diffuse random activity. The model network was activated using patterns inspired by those recorded in vivo. Burst stimulation of a small mossy fiber bundle resulted in granule cell bursts delimited in time (time windowing) and space (center-surround) by network inhibition. This burst-burst transmission showed marked frequency-dependence configuring a high-pass filter with cut-off frequency around 100 Hz. The contrast between center and surround properties was regulated by the excitatory-inhibitory balance. The stronger excitation made the center more responsive to 10-50 Hz input frequencies and enhanced the granule cell output (with spikes occurring earlier and with higher frequency and number) compared to the surround. Finally, over a certain level of mossy fiber background activity, the circuit generated coherent oscillations in the theta-frequency band. All these processes were fine-tuned by NMDA and GABA-A receptor activation and neurotransmitter vesicle cycling in the cerebellar glomeruli. This model shows that available knowledge on cellular mechanisms is sufficient to unify the main functional hypotheses on the cerebellum granular layer and suggests that this network can behave as an adaptable spatio-temporal filter coordinated by theta-frequency oscillations.

Keywords: GABA receptors; NMDA receptors; cerebellar cortex; electrophysiological modeling; granular layer; neural networks; spatio-temporal dynamics.


Figures

Figure 1
Figure 1
Network topology. (A) Elements of the network. (i) The whole network: the granular layer network was simulated as a cube with edge length 100 μm. It contained 4096 GrCs (blue dots), 27 GoCs (green spheres), and 315 glomeruli (red and cyan dots). The meaning of the eight glomeruli indicated with cyan dots is explained in (B). (ii) GoC–GrC divergence: the panel shows the glomeruli reached by a single GoC axon and GrCs inhibited therein. (iii) Mf–GoC convergence: The panel shows the glomeruli reaching a single GoC. Note that GoC–GrC divergence is wider than mf–GoC convergence, setting the basis for lateral inhibition. (B) Neurons responding to an input burst delivered to a small mf bundle. In this example, which is drawn from the network shown in (A), eight glomeruli represented with cyan dots were supposed to delivered a burst (five spike at 500 Hz) to the network. One of the GoCs excited by the burst [the same as in (ii)] is indicated with a large green dot. The GrCs are indicated with small dots: GrCs that are only inhibited are yellow, GrCs that are only excited are blue, GrCs that are both excited and inhibited are green. Note that excitation is concentrated in the center and inhibition in the surround. (C) Schematic drawing of network connectivity [same color code as in (B)].
Figure 2.
Figure 2.
Responses of GrCs and GoCs in the network. (A) The response of a GrC (A1) and a GoC (A2) to current injection. As in all the following simulations, the neurons are affected by background activity. The GrCs show EPSPs (open arrow) caused by mf activity and IPSPs (filled arrow) caused by GoC activity (the IPSPs are only visible when the neuron is depolarized, since GABA-A receptor Cl reversal potential is almost coincident with resting potential). The GoC shows a low-amplitude synaptic noise, caused by mf and pf EPSPs (open arrow) and by SC/BC IPSPs (filled arrow), and low-frequency spiking due to intrinsic pacemaking. Both the GrC and the GoC maintain their characteristic discharge patterns previously described in slice preparations. The GrC shows a discharge proportional to injected current. The GoC shows (1) pacemaking, (2) spike frequency adaptation during depolarization, (3) sagging inward rectification, (4) rebound excitation following hyperpolarization, (5) phase reset after a high-frequency burst. (B) Input–output relationships for a GrC (B1) and a GoC (B2) in response to current injection. The GrC shows fast inward rectification (the V/I curve is fitted with two straight lines, with slope corresponding to input resistance of 842 MOhm and 2 GOhm, respectively). The GrC shows an almost linear spike frequency increase up to 500 Hz. The GoC does not show fast inward rectification (the V/I curve is fitted with a single straight lines, with slope corresponding to input resistance 80 MOhm). The GrC shows an almost linear spike frequency increase up to 300 Hz and a rapid adaptation nearly halving the firing frequency. (C) The effect of an input spike burst (five spikes at 100 Hz on eight contiguous mfs) on GrCs (C1) and GoCs (C2, C3). Examples are taken from neurons receiving a variable number of mf inputs. The GrCs (C1) receive from one to five active inputs. With weak activation EPSP short-term depression is visible (thick trace also enlarged in the inset), while with strong activation the GrCs emit short spike bursts. When the GoC receives eight active mf inputs (C2), the different traces show a single spike occurring at different phases of the pacemaking cycle followed by phase reset. Individual EPSPs are small and barely visible (thick trace also enlarged in the inset). When the GoC receives 45 mf inputs (5 spikes at 500 Hz) (C3), the traces show a short burst of two to three spikes at high frequency followed by phase-reset. The spikes in the burst (see inset) arise in 1.5 ms after the stimulus and then occur after 3.3, 7.6 and 47.2 ms.
Figure 3
Figure 3
Subcellular mechanisms of GrC and GoC responses. Response of two exemplar GrCs and one GoC activated by a mf burst (five spikes at 500 Hz on eight contiguous mfs). The top traces show intracellular membrane potential while the bottom traces show the synaptic membrane currents. All glutamate receptor-dependent currents (A = AMPA, N = NMDA, K = kainate) are downward while the GABA-A receptor-mediated currents (G = GABA-A: α1 and α6 receptor-mediated currents together) are upward, except when changes in the driving force invert the current sign (glutamate reversal potential = 0 mV and GABA reversal potential = −65 mV). GrC1 receives only 1 mf input, GrC2 receives 3 mf inputs and 2 GoC inputs. Note inhibition of spike generation by evoked IPSCs in GrC2 (arrow). In contrast to AMPA current short-term depression, the inset shows the NMDA and GABA-A currents build-up up on enlarged scale (vertical axis ×ばつ5). In GoCs, several pf and mf synapses contribute to generate the glutamatergic inputs on apical and basal dendrites, respectively. The pf input involves activation of AMPA, NMDA and kainate receptors, while the mf input activates AMPA and NMDA receptors. The inhibitory input from molecular layer interneurons (MLI) occurs on the apical dendrites. Note generation of a spike doublet by the EPSCs occurring through the feed-forward (filled arrow) and feed-back (open arrow) loops. The pf EPSCs occur with some delay compared to mf EPSCs, accounting for the time required for GrC excitation and pf-GrC transmission, and are interrupted by GoC inhibition of GrCs. MLIs intensify their action just after GrC discharge contributing to terminate GoC inhibition on GrCs.
Figure 4
Figure 4
The impact of molecular/cellular mechanisms on GrC synaptic excitation in the network. (A) Response of GrCs activated by a mf burst (five spikes at 100 Hz on eight contiguous mfs). Each group of traces corresponds to the same 52 GrCs sharing a common bursting mf. The underlying PSTH reports the probability of spike occurrence in 1-ms bins for all (250) GrCs responding to the mf burst. Note that the switch-off of GABA-A α6 receptors and even more of GABA-A α1 + GABA-A α6 receptors, which control the fast and slow components of inhibition, considerably enhances spike generation protracting the duration of the output burst. Blocking the NMDA receptors prevents EPSP temporal summation reducing the GrC response. Decreasing release probability slows down temporal summation while increasing release probability accelerates temporal summation, with opposite effects on the rate of the GrC resposne. (B) The raster-plot shows the timing of individual spikes in different conditions for the same 52 GrCs shown in (A) and for 5 GoC. Note that GoCs, through GABA-A α1 and α6 receptors, regulate the duration of the time window for GrC discharge, which normally lasts 5–10 ms from the stimulus. Repetitive GrC firing is prevented by the block of NMDA receptors and by a low release probability.
Figure 5
Figure 5
Center surround organization and lateral inhibition. (A) Spatial pattern of GrC responses to a short mf burst (two spikes at 500 Hz on eight contiguous mfs) at the time of the first spike (E) and of the second spike (E2). E2−bi indicates the response at the time of the second spike when inhibition is blocked. Since inhibition arises after excitation, it is does not affect generation of the first spike but markedly reduces generation of the second and following spikes. Thus, the influence of inhibition on the GrC response was obtained as (I = E−E2−bi). The difference between excitation and inhibition (E–I) reveals that inhibition is especially effective in reducing excitation around the core, generating a Mexican hat profile. The plots were the average of 10 simulations using different random seeds for synaptic connectivity. (B) Spikegrams for all active GrCs ordered from center to periphery [data from one of the simulation used to make (A)]. The first spikes are indicated by red dots, the second and following spikes by black dots. In the center the first spike occurs about 5 ms after the stimulus, whereas in the surround it tends to occur later. The second spike, which is quite rare in control, becomes well evident when inhibition is blocked. (C) The spatial profile of inhibition (I) was subtracted from the profile of excitation (E) to obtain the E-I balance (E-I) along a section passing through the core of the corresponding plot in (A) (average data obtained from 10 simulations with different random seeds for synaptic connectivity). The larger extension of inhibition compared to excitation and the Mexican-hat profile of the E-I balance are evident.
Figure 6
Figure 6
The impact of network topology on granular layer responses. Granular layer response elicited by a mf burst (five spikes at 500 Hz on eight contiguous mfs) using the control or the mesh-like network configurations (see Materials and Methods). (A) The traces show that responses in the center have shorter latency and higher number of spikes than in the surround of the activated area (exemplar traces are taken at 10 and 32 μm from the core; arrows mark the time of stimulation). The PSTHs (bin width 0.5 ms) were normalized by the number of simulations. The mesh-like configuration reduces the overall level of inhibition, with a more evident effect in the surround, so that the PSTH of peripheral cells shows a remarkable increase in the second/third spike firing probability. (B) The PSTHs of responding GrCs were ordered according to GrC distance from the stimulus center and color coded. In the control network configuration, most neurons fire a high frequency spike doublet with short latency which, in some cases, is followed by a late spike with lower time precision. Some neurons in the periphery fire just a single late spike. The mesh network configuration shows differences in the timing of the first and second spikes and an enhanced probability of third spikes. The mesh-control plot shows sharp peaks in the early response phase due to differences in spike timing and wider peaks in the late response phase due to increase firing probability. (C) Time and space response profiles with control and mesh network configurations. The upper plot shows the mean response of all GrCs. The two curves show a significant difference at the time of the second spike. The point of maximum difference is at 7.2 ms after the stimulus and the difference is significant in the range indicated by the black bar (p < 0.007, t-test). The lower plot illustrates the spatial profile of control and mesh responses at the time of their maximal difference.
Figure 7
Figure 7
Frequency-dependence of granular layer responses. (A) The raster plot shows the response of all GrCs (blue dots) and GoCs (green dots) to a bursts (five spikes at 20 Hz) on eight contiguous mfs (red dots). (B) The GrC membrane potential (traces are the sum over all active GrCs) shows poor temporal summation at low stimulation frequency (20 Hz) but marked temporal summation at high frequencies (>100 Hz). (C) The gain function showed a steep increase above 50 Hz. By blocking the NMDA receptors, the responses were depressed with a specific loss of transmission at low frequency. By blocking GABA receptors, the responses were enhanced with a more marked increase of transmission at low frequency. Reducing release probability (p = 0.2) depressed the gain curve at all frequencies, while raising release probability (p = 0.9) enhanced the gain curve specifically at low frequency. (D) The gain curve changed from the center to surround of the excited area. In the center the gain curve arose at lower frequencies and attained higher gain than in the surround. (i) shows absolute gain curves, (ii) shows normalized gain curves. Each gain trace is from a different GrC. (E) Gain as a function of distance from the center of the active areas. The points are measures in responding spots located along different radii (mean ± sd indicate the values along the whole circumference at the given distance; see Materials and Methods for details). The difference between center and surround in terms of gain was more pronounced at high than low input frequency.
Figure 8
Figure 8
Background activity and oscillations. (A) The response of GrCs and GoCs to a 20-Hz mf random activity. Activity of individual GrCs was sparse and appeared to occur at random and uncorrelated times [membrane potential traces, (i)]. However, when represented in a raster plot (ii), GrC (blue dots) and GoC (green dots) activity appeared organized in a repetitive coherent pattern. (B) Autocorrelograms of GrC and GoC population activity at three different frequencies of the random input (10 Hz, 20 Hz, 40 Hz; (i,ii)). The autocorrelogram of GrCs is enlarged in the inset. The cross-correlogram shows the mean activity of the GoCs in relation to spikes fired by GrCs (iii). (C) The power spectrum density (PSD) of the GrC population activity shows a peak between 7 and 20 Hz at the three different input frequencies [(i): 10 Hz, 20 Hz, 40 Hz]. These peaks are represented as a function of the input frequency in (ii). (D) The effect of altering neurotransmission mechanisms on the GrC power spectral density generated with a 20-Hz mf random activity. Blocking NMDA receptors reduced the PSD peak frequency, while blocking GABA-A receptors increased the PSD peak frequency. Decreasing mf-GrC release probability (p = 0.2) reduced the PSD peak frequency, while increasing mf-GrC release probability (p = 0.9) increased the PSD peak frequency. (E) The effect of altering the strength of GoC excitation through the mfs and of GoC inhibition through MLI on the GrC power spectral density generated with a 20-Hz mf random activity. The oscillatory effect, revealed by the intensity of the GrC PSD, tends to vanish as the intensity of the feed-forward inhibitory loop is increased and as the intensity of the feed-back dis-inhibitory loop is increased.

References

    1. Albus J. S. (1971). A theory of cerebellar function. Math. Biosci. 10, 25–6110.1016/0025-5564(71)90051-4 - DOI
    1. Arenz A., Silver R. A., Schaefer A. T., Margrie T. W. (2008). The contribution of single synapses to sensory representation in vivo. Science 321, 977–98010.1126/science.1158391 - DOI - PMC - PubMed
    1. Arleo A., Nieus T., Bezzi M., Derrico A., D'Angelo E., Coenen S. O. (2010). How synaptic release probability shapes neuronal transmission: information theoretic analysis in a cerebellar granule cell. Neural Comp. 22, 1113–1148 - PubMed
    1. Armstrong D. M., Rawson J. A. (1969). Activity patterns of cerebellar cortical neurones and climbing fibre afferents in the awake cat. J. Physiol. (Lond.) 289, 425–448 - PMC - PubMed
    1. Barmack N. H., Yakhnitsa V. (2008). Functions of interneurons in mouse cerebellum. J. Neurosci. 28, 1140–115210.1523/JNEUROSCI.3942-07.2008 - DOI - PMC - PubMed

LinkOut - more resources

Cite

AltStyle によって変換されたページ (->オリジナル) /