This site needs JavaScript to work properly. Please enable it to take advantage of the complete set of features!
Skip to main page content
U.S. flag

An official website of the United States government

Dot gov

The .gov means it’s official.
Federal government websites often end in .gov or .mil. Before sharing sensitive information, make sure you’re on a federal government site.

Https

The site is secure.
The https:// ensures that you are connecting to the official website and that any information you provide is encrypted and transmitted securely.

NIH NLM Logo
Log in
Access keys NCBI Homepage MyNCBI Homepage Main Content Main Navigation
. 2010 May 4;107(18):8410-5.
doi: 10.1073/pnas.0907118107. Epub 2010 Apr 15.

Differential olivo-cerebellar cortical control of rebound activity in the cerebellar nuclei

Affiliations

Differential olivo-cerebellar cortical control of rebound activity in the cerebellar nuclei

Freek E Hoebeek et al. Proc Natl Acad Sci U S A. .

Abstract

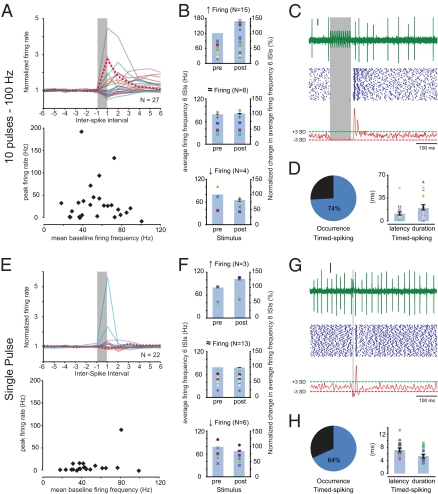
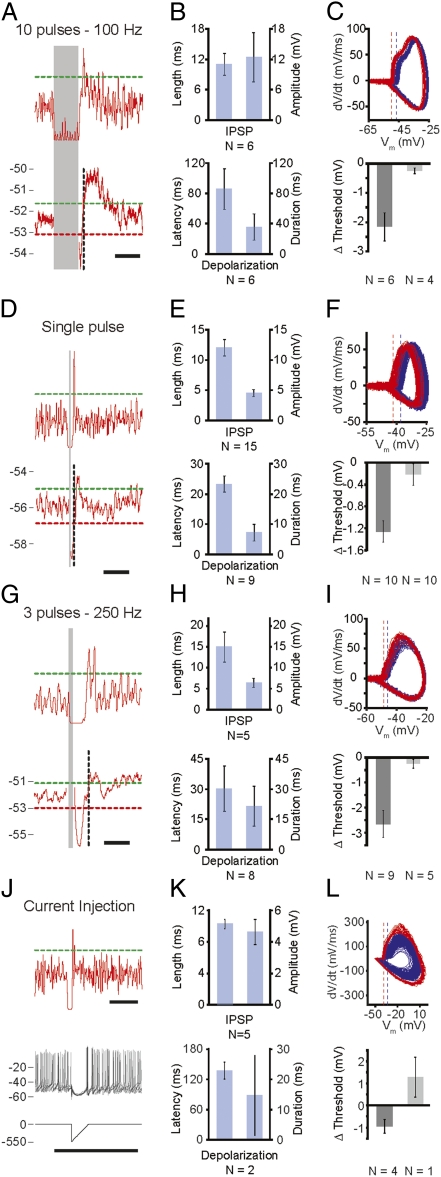
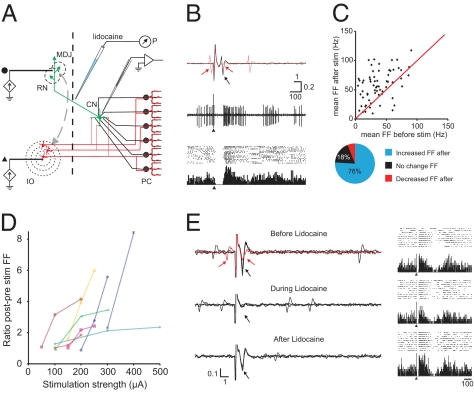
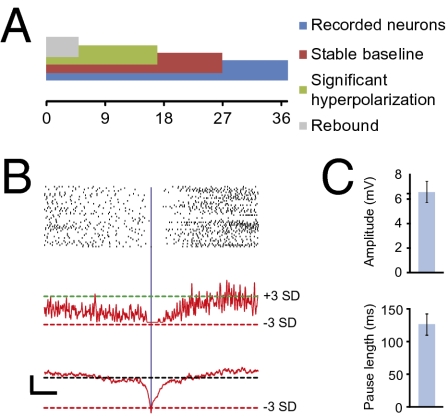
The output of the cerebellar cortex is controlled by two main inputs, (i.e., the climbing fiber and mossy fiber-parallel fiber pathway) and activations of these inputs elicit characteristic effects in its Purkinje cells: that is, the so-called complex spikes and simple spikes. Target neurons of the Purkinje cells in the cerebellar nuclei show rebound firing, which has been implicated in the processing and storage of motor coordination signals. Yet, it is not known to what extent these rebound phenomena depend on different modes of Purkinje cell activation. Using extracellular as well as patch-clamp recordings, we show here in both anesthetized and awake rodents that simple and complex spike-like train stimuli to the cerebellar cortex, as well as direct activation of the inferior olive, all result in rebound increases of the firing frequencies of cerebellar nuclei neurons for up to 250 ms, whereas single-pulse stimuli to the cerebellar cortex predominantly elicit well-timed spiking activity without changing the firing frequency of cerebellar nuclei neurons. We conclude that the rebound phenomenon offers a rich and powerful mechanism for cerebellar nuclei neurons, which should allow them to differentially process the climbing fiber and mossy fiber inputs in a physiologically operating cerebellum.


Conflict of interest statement

The authors declare no conflict of interest.

Figures

Fig. 1.
Fig. 1.
Extracellular recordings in CN neurons of awake mice. (A) Responses in the interposed nuclei to stimulation of the paravermal lobules VI/VII with a 100-Hz train of 10 pulses (each pulse 80 μs, 100–300 μA). (Upper) Instantaneous firing rate for the last six ISIs before the stimulus (prestimulus) and six ISIs after the stimulus-induced pause in firing (poststimulus) normalized to the average prestimulus firing frequency. The vertical gray bar (nonscaled) indicates the stimulus and each colored line represents data of an individual cell. The striped, bold, red line indicates data of the typical example in C. (Lower) Peak firing rate during the first six ISIs poststimulus represents the maximum firing frequency beyond the mean baseline firing frequency. (B) The scatter plots (left vertical axes) indicate the average firing frequencies during the last six ISIs prestimulus (Left) and the first six ISIs poststimulus (Right). Each marker indicates data from a single neuron. Bar plots (right vertical axes) indicate the change in average firing frequencies normalized to the mean prestimulus firing frequency. Data in B is grouped by significance of the changes (tested by ANOVA; SI Materials and Methods) in firing frequency. (Top) Fifteen CN neurons showed a significant increase in firing frequency. (Middle) Eight CN neurons showed no significant change in firing frequency. (Bottom) Four CN neurons showed a significant decrease in firing frequency. (C) (Top) Individual trace of CN activity with truncated stimulus artifacts. Vertical scale bar indicates 10 μV. (Middle) Accompanying raster plot of 100 repeats. (Bottom) Gaussian-convolved spiking chance (see main text, SI Materials and Methods, and Fig. S2 for detailed description). Red and green dashed lines indicate the −3 SD and +3 SD thresholds, respectively; crossings with the green dashed line (+3 SD) indicates a significantly (P < 0.001) increased chance of spiking (e.g., timed-spiking). (D) (Left) Pie-chart indicating that 20 out of 27 responsive CN neurons showed timed-spiking in response to a 10 pulses/100 Hz stimulus. (Right) Scatter plots indicate the latency (Left) and duration (Right) of episode of timed-spiking per neuron, and Bar plots indicate the averages. (E–H) As in A to D, using a single-pulse (80 μs, 100–300 μA) stimulus. (E) (Upper) Normalized and (Lower) peak firing rates of CN neurons (n = 22) responded less to a single-pulse stimulus than to a 10-pulses at 100-Hz stimulus train. (F) (Top) Three CN neurons showed significantly increased average firing frequencies during the six ISIs poststimulus compared with the six ISIs prestimulus. (Middle) Thirteen CN neurons showed no significant change. (Bottom) Six CN neurons showed significantly reduced firing frequencies. (G and H) Note the consistent prevalence of timed-spiking activity in response to the single-pulse stimuli.
Fig. 2.
Fig. 2.
Whole-cell in vivo recordings in CN neurons of ketamine/xylazine-anesthetized mice. (A) Stimulation of the cortex by 10 pulses at 100 Hz (paravermal lobules VI/VII, 100-300 μA). (Upper) Gaussian-convolved chance of spiking. The dashed green line indicates a significant increase (+3 SD) of the firing frequency; the gray area indicates the stimulus. (Lower) Average subthreshold membrane potential. The dashed green and red line indicate significantly higher (+3 SD) and lower (−3 SD) membrane-potential thresholds, respectively. The dashed vertical black line indicates the time of the peak in the Gaussian-convolved chance of spiking depicted in the panel above. (Scale bars, 100 ms.) (B) (Upper) Duration and absolute amplitude of the averaged inhibitory postsynaptic potential (IPSP) following the stimulus. (Lower) Latency and duration of the averaged, significant depolarization (SI Materials and Methods). (C) (Upper) Membrane potential (Vm) re first Vm derivative (dV/dt) indicating the more negative average initiation threshold (dashed lines) for action potentials directly following the stimulus-induced hyperpolarization (rebound; red) and during baseline (blue) for the typical example represented in A. (Lower) Average difference in initiation thresholds (Δ threshold) between baseline and rebound action potentials for reacting (Left; dark gray; n = 6) and nonreacting (Right; light-gray; n = 4) CN neurons. (D–F and G–I) Same as for A to C using a single-pulse stimulus and a three-pulses–250 Hz stimulus train, respectively. (F) n = 10 for both reacting and nonreacting CN neurons. (I) n = 9 for reacting and n = 5 for nonreacting CN neurons. (Scale bars in D and G, 50 ms.) (J) Typical response to an inhibitory postsynaptic current-like current input. (Top) Similar to A. (Middle) Five example traces showing a clear IPSP-like response followed by a timed action potential with a lowered initiation threshold compared with baseline action potentials. (Bottom) A 550 pA hyperpolarizing current injection immediately followed by a repolarizing ramp of 20 ms evoked an IPSP-like waveform in this typical CN neuron. (Scale bar, 100 ms.) (K and L) Similar to B and C. (L) n = 4 for reacting and n = 1 (error bars indicate SEM of recordings) for nonreacting CN neurons.
Fig. 3.
Fig. 3.
Strong rebound firing in identified CN neurons can be controlled by olivary input. (A) Experimental setup consists of tungsten stimulation electrodes placed in the IO as well as the red nucleus (RN) and mesodiencephalic junction (MDJ) in the midbrain, an injection pipette with lidocaine at the decussation of the superior cerebellar peduncle, and a recording electrode in the CN. Black dot and triangle: stimulus location for traces shown in B and E. P, pressure pump; PC, Purkinje cells. (B) Identification of CN neuron and typical response to IO stimulation. (Top) Three superimposed traces of a CN neuron indicate an antidromic response (black arrow) upon RN-MDJ stimulation at 150 μA. The red sweep shows that a collision with a spontaneous spike blocks the antidromically triggered action potential (red arrows). All 66 analyzed neurons responded in this way to RN-MDJ stimulation. These units did not respond with antidromic activation to IO stimulation, although orthodromic spikes were frequently triggered at short latencies (Fig. S6 E and F). (Middle) IO stimulation (single sweep, single pulse of 200 μA at arrowhead) results in a pause of approximately 60 ms followed by an increase in firing rate. (Bottom) Peristimulus time histogram and accompanying raster plot show the consistency of this phenomenon. (C) (Upper) diagram shows the average firing frequency during the last 250 ms before IO stimulation against the average firing frequency during the first 100 ms after the pause. Firing frequencies were based on averages of ≥15 sweeps. Red line indicates the unity line. (Lower) Pie-chart indicates the percentage of recorded neurons with statistically significant changes in firing frequency for 50 ms or 250 ms poststimulus. (D) Increasing IO stimulation strength results consistently in increased ratios of post/prestimulus firing frequencies as shown for eight CN neurons. (E) Effect of blocking cerebellar output on poststimulus rebound firing. (Top) identification of a CN neuron by RN stimulation including collision trace (red) and the peristimulus time histogram and raster diagrams to IO stimulation (10 sweeps, 300 μA). (Middle) responses to RN stimulation of the same unit 5 min after lidocaine (2%, 50–100 nL) injection. Note that antidromic response (and evoked field) had completely disappeared, but that poststimulus rebound activation can still be noted upon the same IO stimulation. (Bottom) responses after recovery from lidocaine (20 min after injection); antidromic responses have returned and IO stimulation results in near-identical responses as seen during blockage of cerebellar output. Horizontal bars indicate time in milliseconds, vertical bars indicate mV.
Fig. 4.
Fig. 4.
Spontaneous rebound discharges in CN neurons. (A) Summary of analyzed cells, bars are overlapping and represent fractions of the total number of neurons (n = 37). (B) Representation of spontaneous rebound discharges of typical CN neuron. (Top) Rasterplot and (Middle) Gaussian-convolved representation of normalized chance of spiking. The dashed horizontal green and red lines indicate a significantly (+3 SD and −3 SD, respectively) increased and decreased chance of spiking, respectively. (Bottom) Accompanying subthreshold membrane potential. Dashed black line indicates the average subthreshold membrane potential (−49.9 mV) and the dashed red line indicates significant hyperpolarizations. [Scale bars, 5 mV (horizontal) and 100 ms (vertical).] All plots are aligned to the significant hyperpolarization (vertical blue line). (C) (Upper) Summary of mean spontaneous IPSP amplitude and (Lower) the accompanying mean length of the pause in firing.

References

    1. Pugh JR, Raman IM. Nothing can be coincidence: Synaptic inhibition and plasticity in the cerebellar nuclei. Trends Neurosci. 2009;32:170–177. - PMC - PubMed
    1. De Zeeuw CI, Berrebi AS. Postsynaptic targets of Purkinje cell terminals in the cerebellar and vestibular nuclei of the rat. Eur J Neurosci. 1995;7:2322–2333. - PubMed
    1. Teune TM, van der Burg J, van der Moer J, Voogd J, Ruigrok TJ. Topography of cerebellar nuclear projections to the brain stem in the rat. Prog Brain Res. 2000;124:141–172. - PubMed
    1. Uusisaari M, Knöpfel T. GABAergic synaptic communication in the GABAergic and non-GABAergic cells in the deep cerebellar nuclei. Neuroscience. 2008;156:537–549. - PubMed
    1. Chan-Palay V. Cerebellar Dentate Nucleus: Organization, Cytology and Transmitters. Berlin: Springer-Verlag; 1977.

Publication types

LinkOut - more resources

Cite

AltStyle によって変換されたページ (->オリジナル) /