This page was rendered on
10-Nov-25 1256 UTC.
This page was first created as HFRadio.org in the mid 1990s, and morphed here in 1998, by Tomas David Hood (NW7US)
Current Sunspot Cycle 25 Activity ~ Space Weather ~ Shortwave Radio Propagation
Sun Spots:
126 as of 11/09/2025
:: 10.7-cm Flux:
176
SFU
(SFU=Solar Flux Units)
Space Weather Overview Graphic from SWPC
30 Minutes of Dazzling Sun! Ultra-high Definition 4k View
[
埋込みオブジェクト:https://www.youtube.com/v/sq4PlyNkm2Y&hl=en_US&fs=1& type=]
An Intimate View of the Sun, Every Day of 2015 (Year 6 of SDO) UHD 4k
[
埋込みオブジェクト:https://www.youtube.com/v/HgP0e1VHBxc&hl=en_US&fs=1& type=]
Watch Five Very Intense X-class X-ray Flares Erupt, Back-to-back!(From the largest sunspot region in 20+ years...)
[
埋込みオブジェクト:https://www.youtube.com/v/RWSOkdAU0Vs&hl=en_US&fs=1& type=]
Check out the X2.7 X-ray Flare (May 5 2015) - 'Biggest' of 2015, so far
[
埋込みオブジェクト:https://www.youtube.com/v/VQUFRrlqJLk?&hl=en_US&fs=1& type=]
See highlights of the last five years of the Sun, as seen by SDO
[
埋込みオブジェクト:https://www.youtube.com/v/zXN-MdoGM9g&hl=en_US&fs=1& type=]
Planetary A-index (
Ap):
8
| Planetary K-index (
Kp):
2.33
Solar Wind:
551 km/s at
11.0 protons/cm3, Bz is
6.0 nT
(Nov 10, 2025 at 1246 UT)
X-ray Solar Flares:
6h hi [
X1.7][0701Z 11/09] 24h hi [
X1.7][0701Z 11/09]
Background X-ray Level, Last Six Days
::
::
::
::
::
::
Check out the current Aurora Oval and activity.
What is the difference between the CB and Amateur Radio Services, in the USA? Here are some thoughts on the portrayal of the Amateur Radio Service by the Hit TV Series, NCIS, and a clarification of the difference between CB radio and ham radio.
(Skip to timecode 1:33 to bypass the introductory chat and talk about the headset microphone.)
[
埋込みオブジェクト:https://www.youtube.com/v/pIWJ7kKbxiM&hl=en_US&fs=1& type=]
Here is a video introduction to shortwave / HF amateur radio -- what is it that we amateur radio oprators listen to? If you have not yet been introduced to this world, this is a very basic introduction.
[
埋込みオブジェクト:https://www.youtube.com/v/pIVesUzNP2U&hl=en_US&fs=1& type=]
If you are using software utilities such as Ace-HF, that require a "smoothed" sunspot number
(Referred to as the
SSN), or, the
smoothed 10.7-cm Radio Flux Index,
use the following predicted values in this following table:
Predicted SMOOTHED Sunspot Number And Radio Flux Values
With Expected Ranges
YR/MO
Smoothed Sunspot Number
Predicted/High/Low
Smoothed 10.7 cm Radio Flux
Predicted/High/Low
To understand more about the Maximum Usable Frequencies, and related
science, please
read the MUF Basics Page.
Global HF Propagation Conditions for 0400Z on 05 May, 2021
High Latitude: Normal
Middle Latitude: Normal
Low Latitude: Normal
Geomagnetic Latitude Ranges:
High: 60-90 degrees
Middle: 20-60 degrees
Low: 0-20 degrees
Videos of Interest - Space Weather, Solar Dynamics Observatory, STEREO, and more... from the
NW7US YouTube Channel. (Click on the small image to launch the video...)
The NW7US Current Sunspot and Geophysical Activity Report
The observations, prognastications, and comments by NW7US
NW7US is Tomas David Hood, Propagation and Space Weather Columnist
for CQ Communications
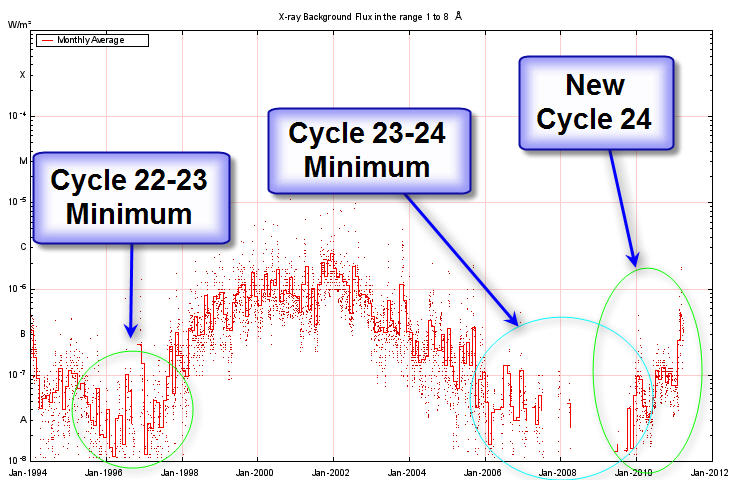
More about Background X-rays
The hard X-ray energy present from the wavelengths of 1 to 8 Angstroms provide the most effective ionizing energy throughout all of the ionospheric layers in our atmosphere. The GEOS satellites measure these wavelengths and the resulting measurements are reported as the "background X-ray level" throughout the day. A daily average is reported, as well.
Just like X-ray flares, the background hard X-ray level is measured in watts per square meter (W/m2), reported using the categories, A, B, C, M, and X. These letters are multipliers; each class has a peak flux ten times greater than the preceding one. Within a class there is a linear scale from 1 to 9.
If one records the daily background X-ray levels for the course of a sunspot cycle, one would discover that the background X-ray levels remained at the A class level during the sunspot cycle minumum. During the rise and fall of a solar cycle, the background X-ray energy levels remained mostly in the B range. During peak solar cycle periods, the background energy reached the C and sometimes even M levels.
Armed with this information, can we discover any clues as to the current status of Sunspot Cycle 24? Below is a graph plotting the background hard X-ray energy reported by the GEOS satellites since the end of Sunspot Cycle 22. Clearly, we see a noticeable rise in Cycle 24 activity. We're seeing the energy mostly in the B level more often, supporting the view that Cycle 24 is alive and moving along toward an eventual sunspot cycle peak in several years.
Overall, the monthly average background 'hard' X-ray level is rising (as seen by the following plot), showing a change from deep solar cycle minimum. We are certainly in the rising phase of Sunspot Cycle 24. While it has been a slow up-tick over the last eighteen months, I expect to see a more rapid rise during mid to late 2011.
Background X-ray (1 to 8 Angstrom) Plot
Highlights of Solar and Geomagnetic Activity
Covering the period: 05 - 11 August 2024
Solar activity was ranged from moderate to high levels. 34 events, which ranged from R1-R3 (Minor-Strong), were observed during the week. Region 3767 (S10, L=318, class/area=Dso/beta on 27 Jul) produced the strongest flare of the period, an X1.7/Sf at 05/1340 UTC. Two other regions produced X-class activity with an X1.1/2b at 05/1527 UTC from Region 3780 (S12, L=173, class/area=Fkc/1280 on 09 Aug) and an X1.3/2b flare at 08/1935 UTC from Region 3777 (S09, L=209, class/area=Ekc/460 on 09 Aug).
CME activity observed over 07-08 Aug from multiple sources were analyzed and considered likely to be Earth-directed with a transit time of 3-4 days. An additional CME associated with an M5 (R2-Moderate) flare at 10/0237 UTC produced a faint halo signature first observed in SOHO/LASCO C2 imagery at 10/0312 UTC. Analysis and modeling suggested arrival on 12 Aug.
The greater than 10 MeV proton flux observed at geosynchronous orbit became slightly enhanced over 05-06 Aug, but well below the 10 pfu (S1-Minor) threshold due to energetic activity on the Sun's farside.
The greater than 2 MeV electron flux at geosynchronous orbit was at normal background levels.
Geomagnetic field activity ranged from quiet to G1 (Minor) storm levels. G1 conditions were observed on 11 Aug, likely due to the influence of passing CMEs that left the Sun over 07-08 Aug. Total magnetic field strength increased to ~11 nT on 10 Aug and increased to a peak of 21 nT on 11 Aug. Solar wind speeds steadily climbed during that time from ~350 km/s to just over 500 km/s at the end of 11 Aug. The Bz component was primarily oriented neutral or northward which resulted in a limited geomagnetic response. A brief period of -20 nT was observed during the final hour of 11 Aug. The remainder of the summary period was at quiet to unsettled levels.
Monthly and smoothed sunspot number - The monthly mean sunspot number (blue) and 13-month smoothed monthly sunspot number (red) for the last five cycles. You can see that this current cycle, Cycle 24, is a weak cycle, compared to the last few.
(Click to see actual size)
Monthly and smoothed sunspot number chart
Daily and monthly sunspot number (last 13 years)
Daily sunspot number (yellow), monthly mean sunspot number (blue), smoothed monthly sunspot number (red) for the last 13 years and 12-month ahead predictions of the monthly smoothed sunspot number:
SC (red dots) : prediction method based on an interpolation of Waldmeier's standard curves; It is only based on the sunspot number series.
CM (red dashes) : method (from K. Denkmayr and P. Cugnon) combining a regression technique applied to the sunspot number series with the aa geomagnetic index used as a precursor (improved predictions during the minimum phase between solar cycles).
(Click to see actual size)
Daily and monthly sunspot number (last 13 years)
What is 'Space Weather'? Click on these two information slides to view them in full size:
What is Space Weather? Slide 1 of 2
What is Space Weather? Slide 2 of 2
STEREO IMAGES
Real Time Solor Wind and Aurora:
On 2025 Nov 10 1250Z: Bz: 4.2 nT
Bx: -2.9 nT | By: -5.5 nT | Total: 7.5 nT
Most recent satellite polar pass:
Centered on // : UTC
Aurora Activity Level was at UTC
visit
noaa for latest.
Outlook:
09 Nov 2025 10.7-cm Flux: 171 / Ap: 009
10 Nov 2025 10.7-cm Flux: 170 / Ap: 013
11 Nov 2025 10.7-cm Flux: 167 / Ap: 008
Forecast:
Solar Flares:
M-class flares expected (probability>=50%)
Geo-Disturbance:
Active conditions expected (A>=20 or K=4)
Solar Proton Event:
Quiet
(Comments issued on 09 Nov 2025, 1240UT)
Three Day Forecast of Solar and Geomagnetic Activity
(as of 2200Z on 07 Dec 2014)
Solar Forecast:
Solar activity is expected to be low with a chance for M-class flares on days one, two, and three (08 Dec, 09 Dec, 10 Dec).
Geomagnetic Forecast:
The geomagnetic field is expected to be at quiet to minor storm levels on day one (08 Dec), quiet to active levels on day two (09 Dec) and quiet levels on day three (10 Dec).
Forecast of Solar and Geomagnetic Activity
12 August - 07 September 2024
Solar activity is expected to reach moderate (R2-Moderate) conditions, with a chance for R3-Strong events, over 12-18 Aug due to multiple complex regions on the visible disk. R1 (Minor) conditions remain likely on most days through the end of the outlook period due to the anticipated return of multiple complex regions from the Sun's farside.
No proton events are expected at geosynchronous orbit.
The greater than 2 MeV electron flux at geosynchronous orbit is expected to be at normal background to moderate levels throughout the outlook period.
Geomagnetic field activity is expected to reach G2 (Moderate) levels on 12 Aug due to the passing of multiple CMEs from 08 Aug and 10 Aug. As CME influence wanes, active conditions over 14 Aug are likely to decrease to unsettled levels over 14-15 Aug. Unsettled conditions are again likely on 22-23 Aug in response to a recurrent CH HSS. The remainder of the outlook period is likely to be at quiet levels, excluding any CMEs that have yet to erupt with an Earth-directed component.
Real-time foF2 map from IPS (Ionospheric Prediction Service), Australian Space Weather Agency
foF2 Map from IPS, Australia